
Reason to trust
How Our News is Made
Strict editorial policy that focuses on accuracy, relevance, and impartiality
Ad discliamer
Morbi pretium leo et nisl aliquam mollis. Quisque arcu lorem, ultricies quis pellentesque nec, ullamcorper eu odio.
- Bitcoin price rallied another 4% and climbed above $5,850 against the US Dollar.
- The price is surging higher, but there are many hurdles near $6,000, $6,070 and $6,100.
- There was a break above a crucial bearish trend line at $4,730 on the daily chart of the BTC/USD pair (data feed from Kraken).
- The pair could spike above $6,000 or even towards $6,800 before correcting lower sharply.
Bitcoin price is surging higher towards $6,000 against the US Dollar. BTC could extend gains, but it is facing two important hurdles near $6,100 and $6,800 on the daily chart.
Bitcoin Price Analysis
In the past few days, there was a steady rise in bitcoin price from the $4,000 swing low against the US Dollar. The BTC/USD pair broke the $4,400 and $4,700 resistance levels to start a strong upward move. There was even a close above the $4,200 resistance and the 100-day simple moving average. The bulls pushed the price above the 50% Fib retracement level of the last major decline from the $6,562 high to $3,115 low.
More importantly, there was a break above a crucial bearish trend line at $4,730 on the daily chart of the BTC/USD pair. Recently, the pair broke the $5,250 and $5,500 resistance levels to extend gains. It is now trading well above the 76.4% Fib retracement level of the last major decline from the $6,562 high to $3,115 low. These all are positive signs, suggesting more gains above the $5,900 level. However, there are many hurdles on the upside near the $6,000, $6,070 and $6,100 levels. The $6,070 level was the previous breakdown support and it may now prevent gains.
If there is an upside break above $6,100, there could be an upside extension towards the $6,532 swing high. The main resistance above $6,500 is near the $6,800 level, the main pivot zone of Oct 2018. Therefore, there are chances of a strong bearish reaction from $6,100, $6,500 or $6,800 in the coming days.
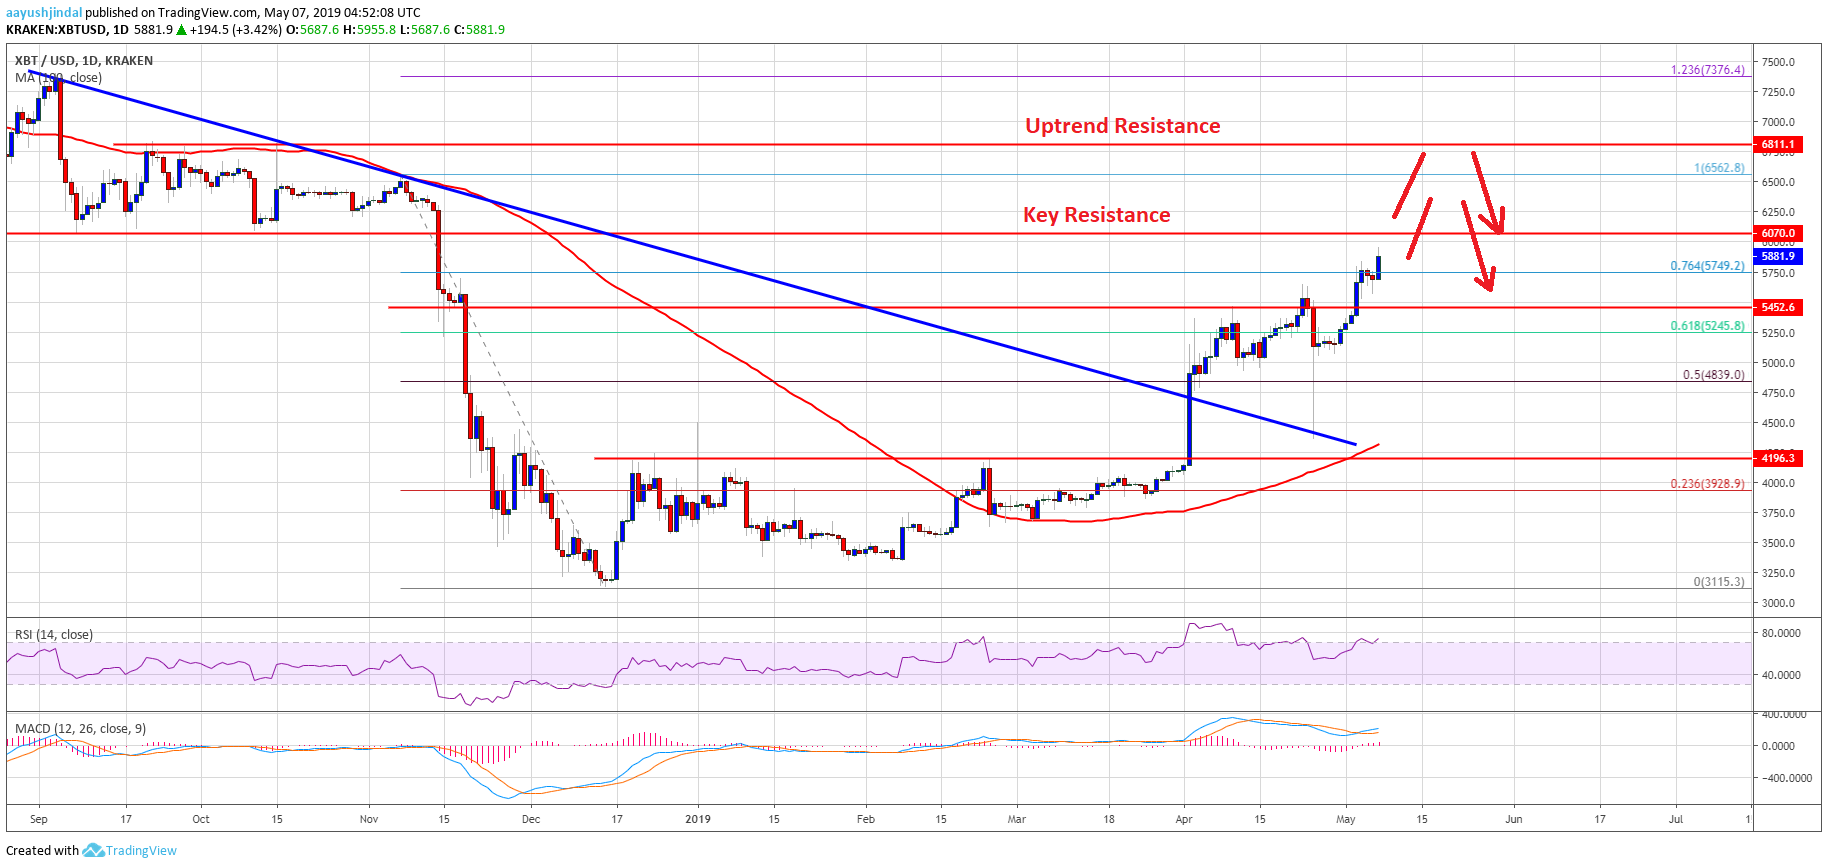
Looking at the chart, bitcoin price seems to be gaining pace above the $5,500 and $5,600 levels. Having said that, the bulls are likely to face a strong offer zone near $6,000, $6,070 and $6,100. If there is a successful close above $6,100, the price may climb higher towards $6,500 or even $6,800 before starting a substantial downside correction. On the downside, there are many supports near $5,540, $5,450 and $5,250. Below these, the price may revisit $5,000.
Technical indicators:
Daily MACD – The MACD is gaining bullish momentum with many positive signs.
Daily RSI (Relative Strength Index) – The RSI for BTC/USD climbed above the 70 level and it seems to be heading towards the 80 level.
Monthly Support Levels – $5,450 followed by $5,250.
Monthly Resistance Levels – $6,070, $6,500 and $6,800.


