Reason to trust
How Our News is Made
Strict editorial policy that focuses on accuracy, relevance, and impartiality
Ad discliamer
Morbi pretium leo et nisl aliquam mollis. Quisque arcu lorem, ultricies quis pellentesque nec, ullamcorper eu odio.
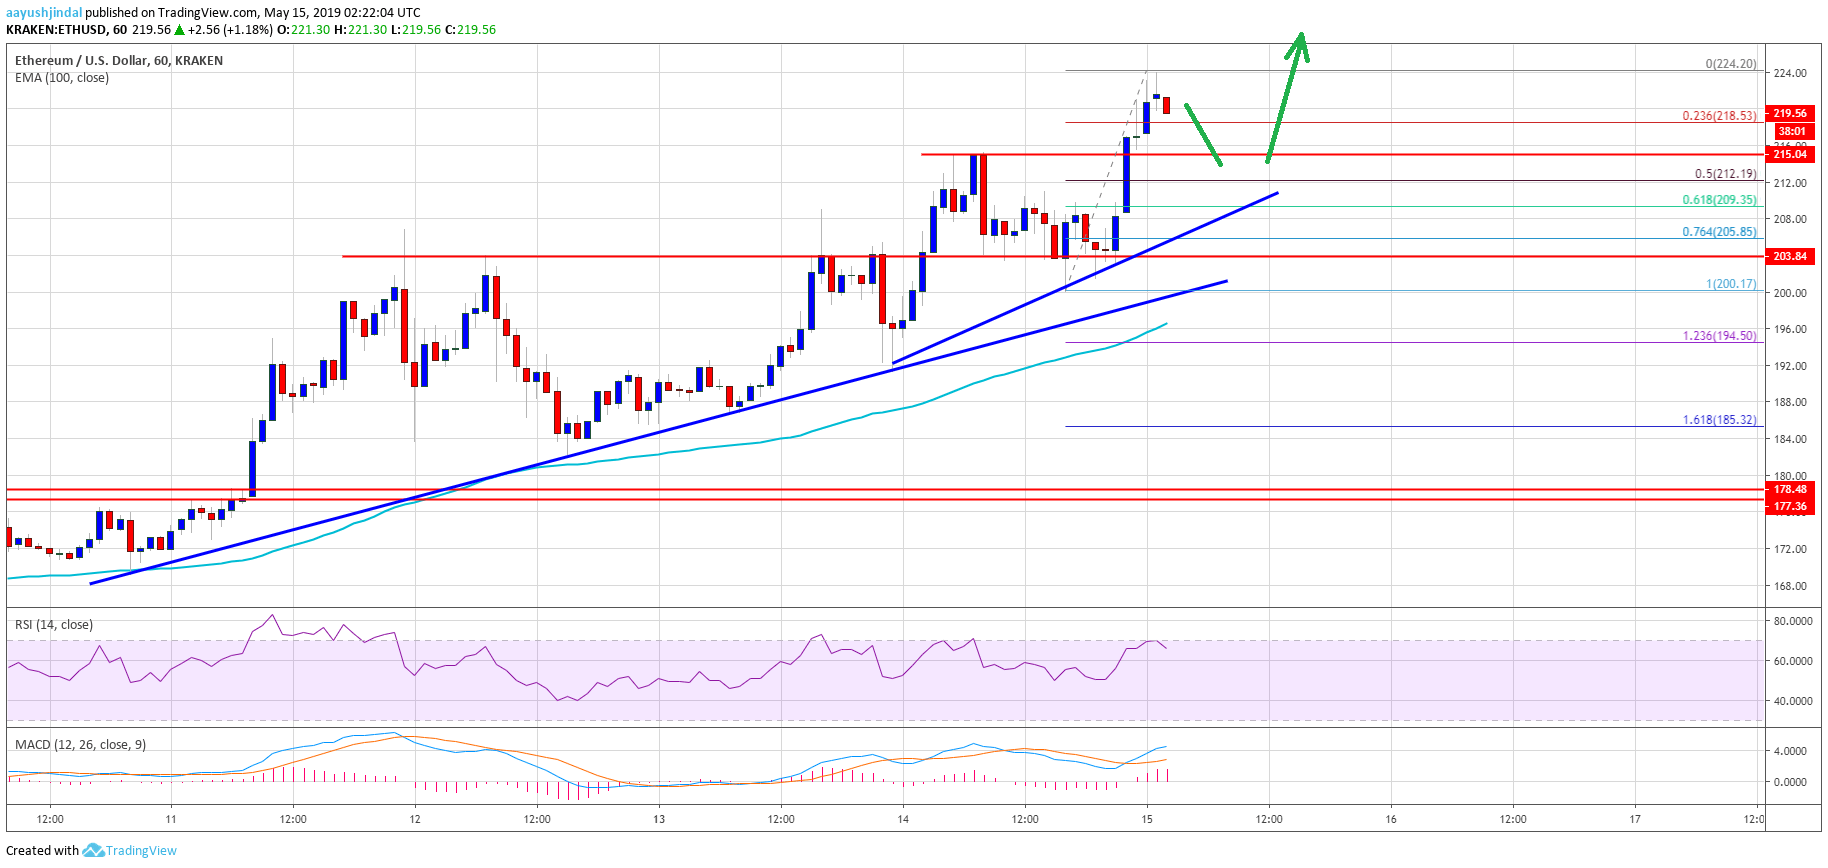
- ETH price climbed above the $210 resistance level and tested the $225 level against the US Dollar.
- The price remains in a strong uptrend and it could soon test the $240 resistance area.
- There is a new short term bullish trend line forming with support near $209 on the hourly chart of ETH/USD (data feed via Kraken).
- The pair remains well supported on the downside near the $215 and $210 levels.
Ethereum price climbed sharply above $220 versus the US Dollar, and recovered a few points vs bitcoin. ETH price is likely to continue higher and the bulls are likely to target the $240 level next.
Ethereum Price Analysis
Yesterday, we discussed the chances of an upside break in Ethereum price above $210 against the US Dollar. The ETH/USD pair formed a decent support base near the $200 level and later climbed above the $210 resistance level. The bulls gained momentum above $215 and the price remained well above the 100 hourly simple moving average. As a result, there was a break above the $220 level and the price tested the first bullish target near $224-225. A swing high was formed near $225 and the price is currently correcting lower.
An immediate support is near the $215 level. The next support is near $212 and the 50% Fib retracement level of the recent wave from the $200 swing low to $225 high. There is also a new short term bullish trend line forming with support near $209 on the hourly chart of ETH/USD. The trend line support coincides with the 61.8% Fib retracement level of the recent wave from the $200 swing low to $225 high. The main support is near the $204 level (the recent resistance area).
On the upside, a break above the $225 level could open the doors more gains. An immediate resistance may be $230, above which the price is likely to surge towards the next bullish target at $240. The current price action indicates a short term downside correction, but the bulls are likely to protect $215 or $212.
Looking at the chart, Ethereum price is clearly gaining pace above key levels such as $200 and $210. As long as the price stays above the $200 pivot level, it is likely to continue higher in the coming sessions. If there is a downside break below $200, the price could start a major correction towards $185.
ETH Technical Indicators
Hourly MACD – The MACD for ETH/USD is currently moving nicely in the bullish zone.
Hourly RSI – The RSI for ETH/USD is currently correcting lower from the 70 level, with a positive bias.
Major Support Level – $212
Major Resistance Level – $225