
Reason to trust
How Our News is Made
Strict editorial policy that focuses on accuracy, relevance, and impartiality
Ad discliamer
Morbi pretium leo et nisl aliquam mollis. Quisque arcu lorem, ultricies quis pellentesque nec, ullamcorper eu odio.
- Bitcoin price started a fresh increase after forming a support base above $6,900 against the US Dollar.
- The price gained bullish momentum above $7,400 and settled above the key $7,650 pivot level.
- There is a major bullish trend line forming with support near $7,610 on the hourly chart of the BTC/USD pair (data feed from Kraken).
- The pair remains well supported on the downside above $7,600 and it could soon break $8,200.
Bitcoin price is positioned nicely in the positive zone above $7,600 against the US Dollar. BTC could correct in the short term, but dips remain supported near $7,760 and $7,650.
Bitcoin Price Analysis
Recently, bitcoin price formed a strong support near the $7,250 level against the US Dollar. The BTC/USD pair started a strong rise from the $7,230 swing low and climbed above the $7,400 resistance level. The recent upward move was such that the price even climbed above the $7,500 resistance and the 100 hourly simple moving average. Finally, there was a clear break above the $8,000 resistance level. The price tagged the main $8,280 resistance level and recently corrected below the $8,150 level.
There was a break below the 23.6% Fib retracement level of the last wave from the $7,230 low to $8,288 swing high. However, the $7,800 level is acting as a strong buy zone. Moreover, the 50% Fib retracement level of the last wave from the $7,230 low to $8,288 swing high is also near the $7,764 level to provide support. More importantly, there is a major bullish trend line forming with support near $7,610 on the hourly chart of the BTC/USD pair. It seems like there is a strong support forming near $7,610 and the 100 hourly SMA.
Besides, the 61.8% Fib retracement level of the last wave from the $7,230 low to $8,288 swing high is also near the $7,640 level. Therefore, if the price corrects lower from the current levels, the $7,760 and $7,650 levels are likely to act as strong supports. If there is a downside break below the $7,600 support zone, the price might move back in a bearish zone.
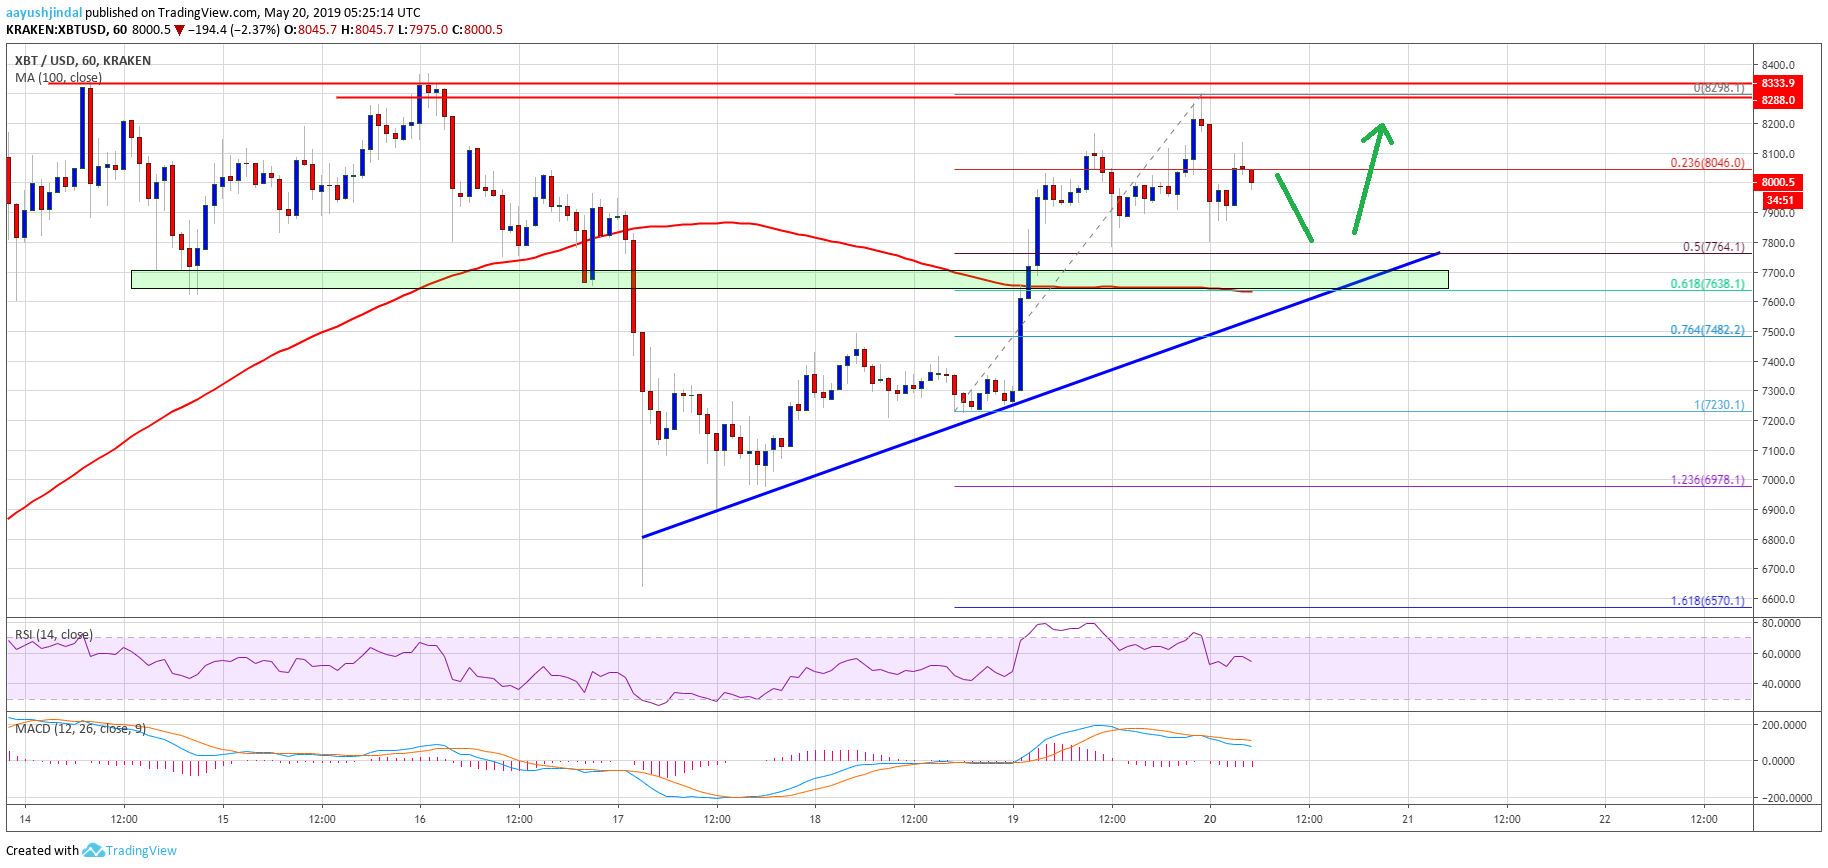
Looking at the chart, bitcoin price is currently trading with a positive bias above the $7,650 support. As long as the price is above $7,600, it is likely to continue higher towards $8,200 and $8,300. A clear break above the $8,300 resistance may perhaps clear the path for more gains above $8,400.
Technical indicators:
Hourly MACD – The MACD is slowly moving in the bearish zone.
Hourly RSI (Relative Strength Index) – The RSI for BTC/USD is moving lower, but it is well above the 50 level.
Major Support Levels – $7,760 followed by $7,650.
Major Resistance Levels – $8,150, $8,200 and $8,300.


