
Reason to trust
How Our News is Made
Strict editorial policy that focuses on accuracy, relevance, and impartiality
Ad discliamer
Morbi pretium leo et nisl aliquam mollis. Quisque arcu lorem, ultricies quis pellentesque nec, ullamcorper eu odio.
- Bitcoin price started a downside correction after tagging the $8,300 resistance against the US Dollar.
- The price tested the $7,575-7,600 support area and recently rebounded towards $8,100.
- Yesterday’s highlighted important bullish trend line is intact with support near $7,810 on the hourly chart of the BTC/USD pair (data feed from Kraken).
- The pair is likely to trade in a range before the next move either towards $8,300 or below $7,575.
Bitcoin price is holding a couple of important supports near $7,600 against the US Dollar. BTC could either climb above $8,100 and $8,300 or start another decline below the $7,575 low.
Bitcoin Price Analysis
After a strong rebound, bitcoin price tested the key $8,300 resistance area against the US Dollar. The BTC/USD pair traded as high as $8,301 and later corrected lower. It traded below the $8,000 and $7,800 support levels. However, the pair found a strong buying interest near the $7,600 support level and a swing low was formed at $7,575. Recently, the price recovered above the $7,800 level and stayed well above the 100 hourly simple moving average.
Moreover, there was a break above the 50% Fib retracement level of the last decline from the $8,301 high to $7,575 low. The price traded above the $8,000 level, but it failed to gain momentum above the $8,120 level. Besides, the 76.4% Fib retracement level of the last decline from the $8,301 high to $7,575 low acted as a strong resistance. The price is currently trading below $8,000, with many supports near the $7,800 and $7,850 levels. More importantly, yesterday’s highlighted important bullish trend line is intact with support near $7,810 on the hourly chart of the BTC/USD pair.
The main support on the downside is near the $7,600 area and the 100 hourly simple moving average. If there is a successful close below the 100 hourly SMA, there could be additional losses towards the $7,300 or $7,200 support. On the upside, a convincing break above the $8,120 level may open the doors for more gains. The main hurdle for the bulls is near the $8,300 level, above which there could be a solid rally towards $8,500.
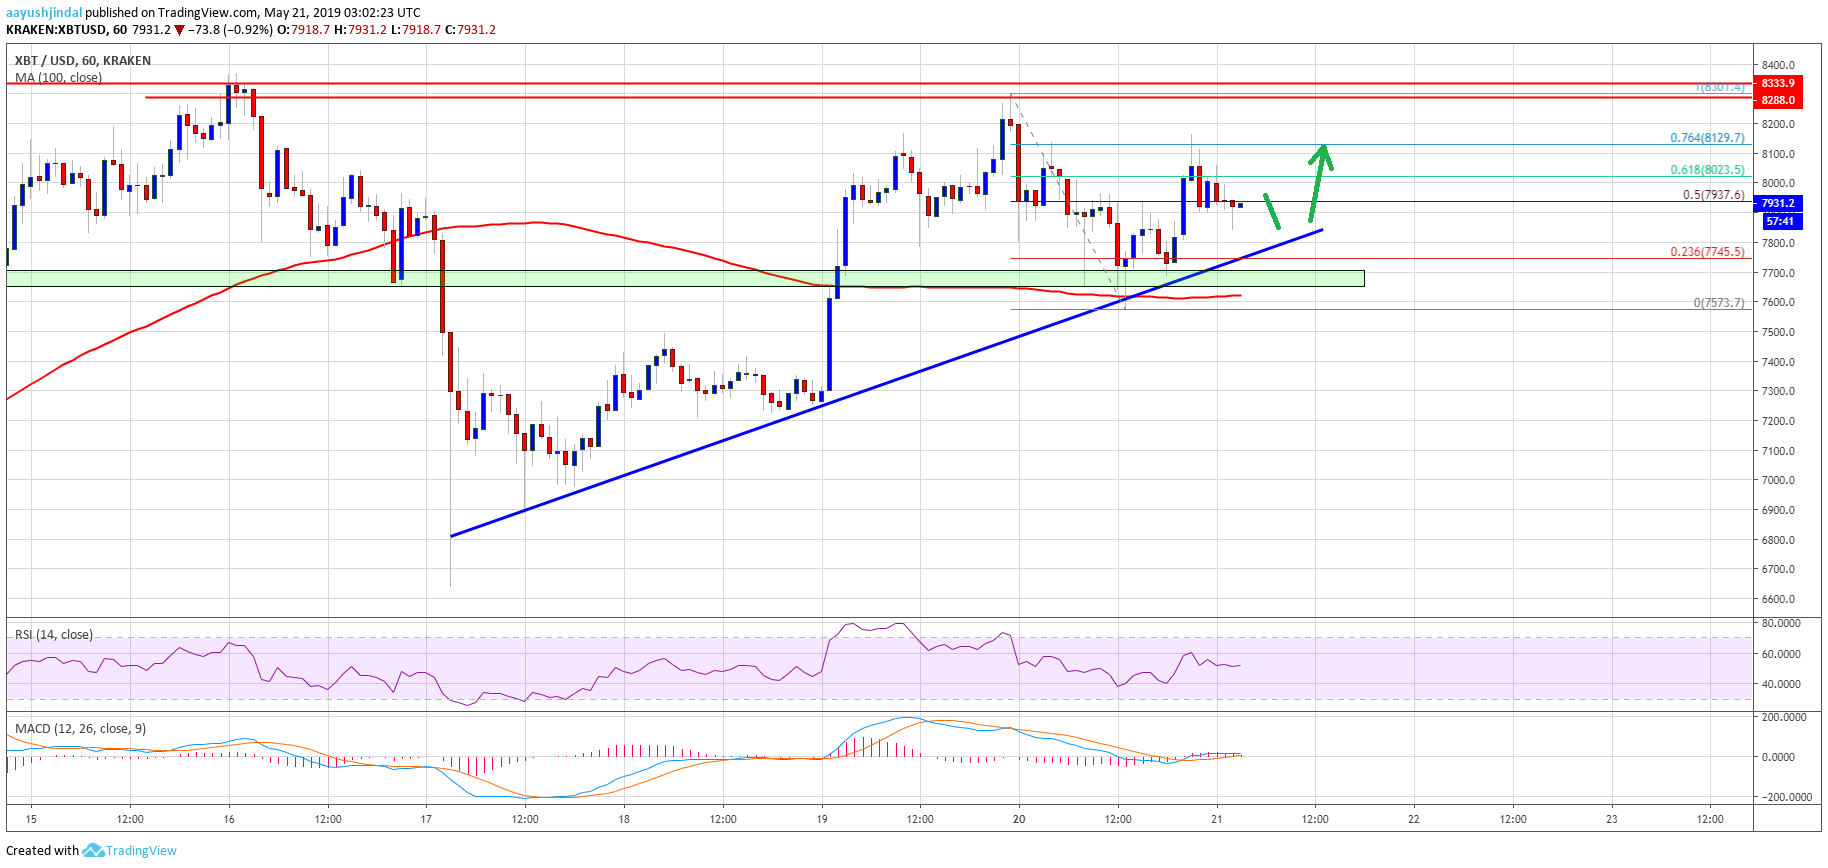
Looking at the chart, bitcoin price is clearly trading above the key $7,800 and $7,600 support levels. As long as there is no close below $7,600, there are high chances of an upside break above the $8,120 and $8,300 resistance levels in the coming sessions.
Technical indicators:
Hourly MACD – The MACD is slightly placed in the bullish zone.
Hourly RSI (Relative Strength Index) – The RSI for BTC/USD is currently above the 50 level, with a flat structure.
Major Support Levels – $7,810 followed by $7,600.
Major Resistance Levels – $8,120, $8,250 and $8,300.


