Reason to trust
How Our News is Made
Strict editorial policy that focuses on accuracy, relevance, and impartiality
Ad discliamer
Morbi pretium leo et nisl aliquam mollis. Quisque arcu lorem, ultricies quis pellentesque nec, ullamcorper eu odio.
- Ripple price failed to break the $0.4300 resistance and recently corrected lower against the US dollar.
- The price declined below the $0.4000 support and tested the $0.3800 support area.
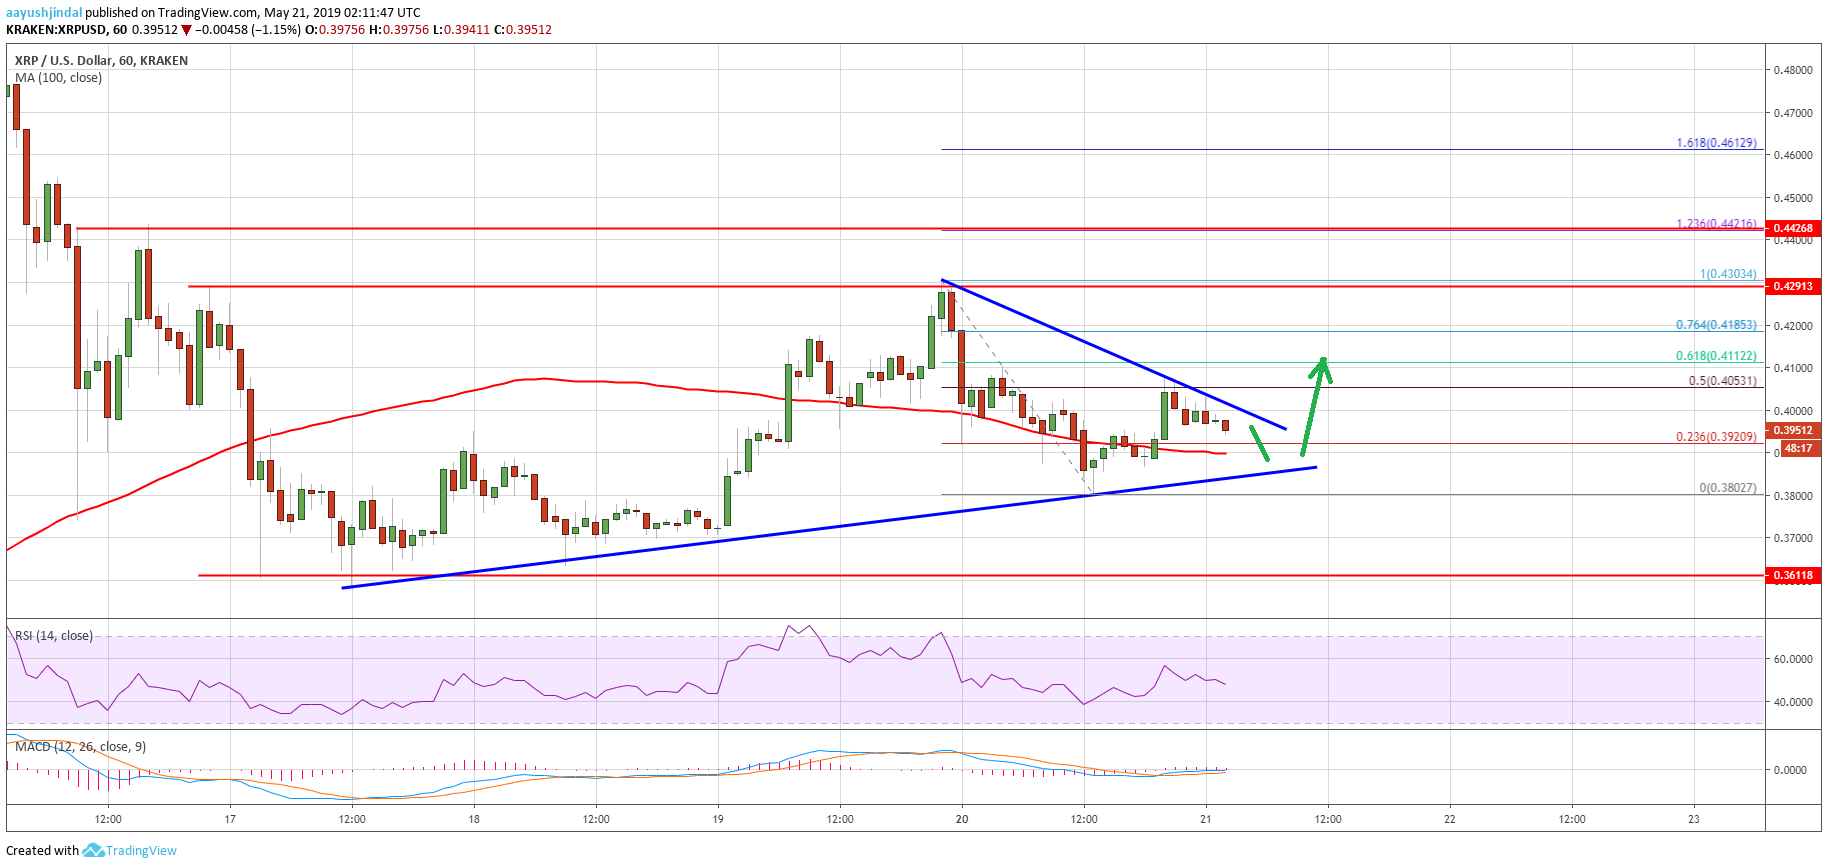
- There is a key bullish trend line forming with support near $0.3850 on the hourly chart of the XRP/USD pair (data source from Kraken).
- The pair may continue to trade in a range above the $0.3610 support area before a fresh increase.
Ripple price is currently consolidating above key supports against the US Dollar, but declining vs bitcoin. XRP must stay above the $0.3600-0.3610 support area to remain in a positive zone.
Ripple Price Analysis
After forming a support base above $0.3600, ripple price rebounded above $0.3800 and $0.4000 against the US Dollar. The XRP/USD pair even climbed above the $0.4150 level and the 100 hourly simple moving average. However, the price failed to trade above the $0.4300 resistance area. As a result, it stared a fresh downside correction below the $0.4150 and $0.4000 level. The price even broke the 100 hourly simple moving average and tested the $0.3800 support level.
A swing low was formed at $0.3802 and the price recently recovered higher. It traded above the $0.3920 level and the 23.6% Fib retracement level of the recent decline from the $0.4303 high to $0.3802 low. The price climbed above the $0.4000 level and tested the $0.4060 level. However, it seems to be struggling near the $0.4050 and $0.4060 levels. The 50% Fib retracement level of the recent decline from the $0.4303 high to $0.3802 low is also acting as a resistance. On the upside, a clear break above the $0.4050 level and connecting bearish trend line is must for more gains.
The next key resistance is near the $0.4150 level, above which the price could revisit the $0.4300 resistance area. On the downside, there are many supports near $0.3800 and $0.3600. There is also a key bullish trend line forming with support near $0.3850 on the hourly chart of the XRP/USD pair. If there is a downside break below the trend line, the price might retest the $0.3600 and $0.3610 support levels.
Looking at the chart, ripple price seems to be consolidating above the $0.3600 support and preparing for the next move. In the short term, there could be some weakness, but the price is likely to reclaim the $0.4150 and $0.4200 levels.
Technical Indicators
Hourly MACD – The MACD for XRP/USD could move back in the bearish zone, with negative signs.
Hourly RSI (Relative Strength Index) – The RSI for XRP/USD is now below the 50 level and it might decline to 40.
Major Support Levels – $0.3850, $0.3800 and $0.3610.
Major Resistance Levels – $0.4050, $0.4150 and $0.4300.


