
Reason to trust
How Our News is Made
Strict editorial policy that focuses on accuracy, relevance, and impartiality
Ad discliamer
Morbi pretium leo et nisl aliquam mollis. Quisque arcu lorem, ultricies quis pellentesque nec, ullamcorper eu odio.
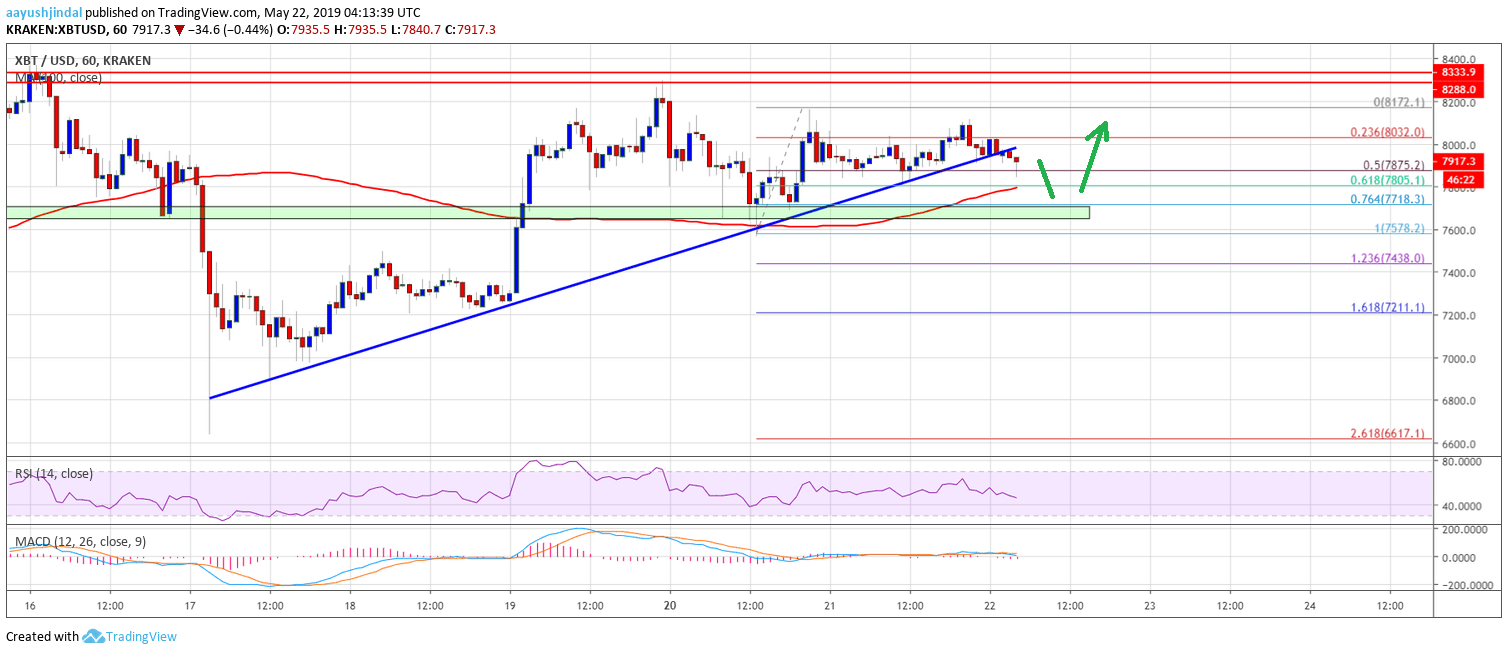
- Bitcoin price failed to gain momentum above $8,150 and $8,200 against the US Dollar.
- The price is slowly moving lower in a range and it could test the $7,700 or $7,660 support.
- This week’s followed key bullish trend line was breached with support near $7,980 on the hourly chart of the BTC/USD pair (data feed from Kraken).
- The pair may continue to trade in a range before a fresh increase above the $8,000 and $8,150 levels.
Bitcoin price is struggling to climb further higher within range against the US Dollar. BTC might decline in the short term before a fresh rise above the $8,200 resistance.
Bitcoin Price Analysis
In the past few sessions, there were swing moves in bitcoin price below the $8,200 resistance area against the US Dollar. The BTC/USD pair recently climbed from the $7,578 swing low to $8,172. However, the pair failed to climb further higher and started a fresh decline below the $8,150 level. There was a break below the $8,050 support and the 50% Fib retracement level of the last wave from the $7,578 swing low to $8,172 high. Moreover, there was a break below the key $8,000 support area.
More importantly, this week’s followed key bullish trend line was breached with support near $7,980 on the hourly chart of the BTC/USD pair. The pair tagged the $7,820 level and the 61.8% Fib retracement level of the last wave from the $7,578 swing low to $8,172 high. The main supports on the downside are near $7,820 and $7,800. Besides, the 100 hourly simple moving average is also near the $7,800 level to prevent a downside break. If there are more losses, the price could revisit the key $7,660 and $7,620 support levels.
On the upside, an immediate resistance is near the $8,000 level. A successful break above the $8,000 barrier could push the price towards the $8,150 level. Having said that, the price could start a strong upward move if it climbs above the $8,200 level in the near term.
Looking at the chart, bitcoin price seems to be trading in a broad range above the $7,600 pivot level. In the short term, there could be range moves, but the price is likely to grind higher towards the $8,000 and $8,200 levels in the coming sessions. The key resistances are $8,280 and $8,300, above which the price might surge towards the $8,500 resistance level.
Technical indicators:
Hourly MACD – The MACD is slowly moving into the bearish zone, with a few negative signs.
Hourly RSI (Relative Strength Index) – The RSI for BTC/USD is currently below the 50 level, with a bearish angle.
Major Support Levels – $7,800 followed by $7,660.
Major Resistance Levels – $8,000, $8,120 and $8,200.


