
Reason to trust
How Our News is Made
Strict editorial policy that focuses on accuracy, relevance, and impartiality
Ad discliamer
Morbi pretium leo et nisl aliquam mollis. Quisque arcu lorem, ultricies quis pellentesque nec, ullamcorper eu odio.
- Ripple price found a strong support near the $0.3800 level and recently moved higher against the US dollar.
- The price is now placed above the $0.3950 and $0.4000 levels and it could continue higher.
- Yesterday’s highlighted major bullish trend line is intact with support near $0.3950 on the hourly chart of the XRP/USD pair (data source from Kraken).
- The pair remains well supported and it could continue to rise above the $0.4100 resistance area.
Ripple price is trading in a bullish zone against the US Dollar, while consolidating vs bitcoin. XRP is likely to climb above $0.4200 as long as it is trading above the $0.3920 level.
Ripple Price Analysis
After a sharp decline, ripple price found support near the $0.3800 area against the US Dollar. The XRP/USD pair traded as low as $0.3802 and recently started an upward move. There was a break above the $0.3920 resistance and the 100 hourly simple moving average. The price slowly moved above the $0.3950 level and the 23.6% Fib retracement level of the downward move from the $0.4300 swing high to $0.3802 low. Moreover, there was a break above the $0.4000 level.
Finally, the price spiked above the $0.4050 level and the 50% Fib retracement level of the downward move from the $0.4300 swing high to $0.3802 low. The price tested the $0.4110 level and the 61.8% Fib retracement level of the downward move from the $0.4300 swing high to $0.3802 low. If there is an upside break above the $0.4110 and $0.4120 levels, there could be more upsides in the near term. The next key resistance is near the $0.4200 and $0.4220 levels.
On the downside, there is a strong support forming near the $0.4000 and $0.3980 levels. More importantly, yesterday’s highlighted major bullish trend line is intact with support near $0.3950 on the hourly chart of the XRP/USD pair. As long as the pair is above the trend line, it could climb above the $0.4050 and $0.4110 resistance levels. Conversely, if there is a downside break below the trend line, the price could extend losses below $0.3920.
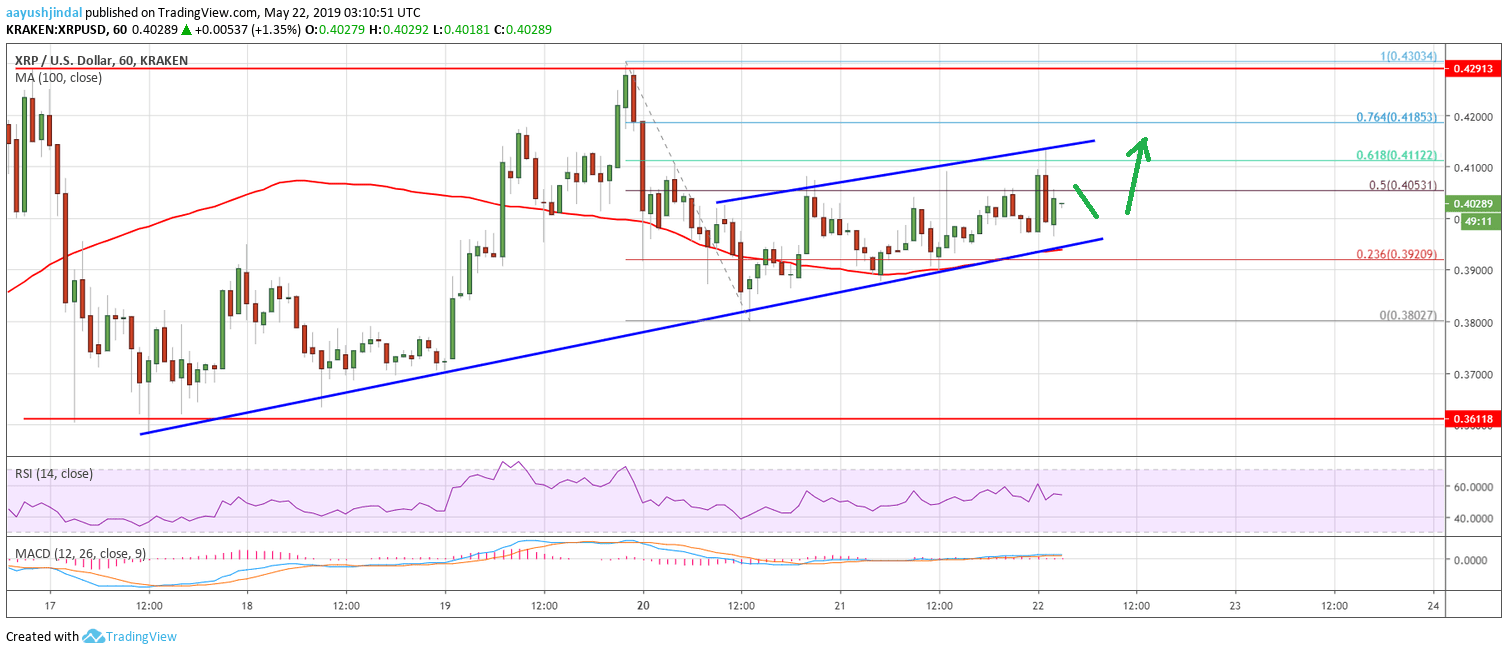
Looking at the chart, ripple price is trading nicely above the $0.3950 support area. Only a close below the 100 hourly SMA is likely to open the gates for more downsides in the near term. Otherwise, the price is likely to trade towards $0.4200 and $0.4220 in the coming sessions.
Technical Indicators
Hourly MACD – The MACD for XRP/USD is slowly gaining momentum in the bullish zone, with positive signs.
Hourly RSI (Relative Strength Index) – The RSI for XRP/USD is now above the 50 level, with neutral signals.
Major Support Levels – $0.3950, $0.3920 and $0.3800.
Major Resistance Levels – $0.4050, $0.4120 and $0.4200.


