
Reason to trust
How Our News is Made
Strict editorial policy that focuses on accuracy, relevance, and impartiality
Ad discliamer
Morbi pretium leo et nisl aliquam mollis. Quisque arcu lorem, ultricies quis pellentesque nec, ullamcorper eu odio.
- Bitcoin price corrected lower recently and tested the $8,425 support against the US Dollar.
- The price bounced back and it is currently trading above the $8,600 resistance area.
- There was a break above a key bearish trend line with resistance at $8,690 on the hourly chart of the BTC/USD pair (data feed from Kraken).
- The pair remains well supported on dips and it is likely to climb above $8,800 in the near term.
Bitcoin price tested the key $8,425 support and the 100 hourly SMA against the US Dollar. BTC bounced back and it is currently gaining momentum above the $8,700 level.
Bitcoin Price Analysis
Yesterday, we saw the start of a downside correction in bitcoin price below $8,700 against the US Dollar. The BTC/USD pair traded below the $8,600 and $8,550 support levels. There was also a break below the $8,500 level. However, the $8,425 support level along with the 100 hourly simple moving average acted as a strong support (as discussed in yesterday’s analysis). Moreover, the 50% Fib retracement level of the upward move from the $7,905 low to $8,950 swing high also acted as a support.
As a result, the price bounced back sharply above the $8,600 and $8,700 resistance levels. Besides, there was a break above the 50% Fib retracement level of the drop from the $8,955 high to $8,433 swing low. More importantly, there was a break above a key bearish trend line with resistance at $8,690 on the hourly chart of the BTC/USD pair. The pair is now trading above the $8,700 resistance. Moreover, it is testing the 61.8% Fib retracement level of the drop from the $8,955 high to $8,433 swing low.
In the short term, there could be a downside correction, but the broken trend line is likely to act as a support near $8,680. Below the $8,680 support, the next key support is near the $8,600 level and the 100 hourly simple moving average. As long as the price is above the 100 hourly simple moving average, there are chances of more gains above the $8,750 and $8,800 resistance levels.
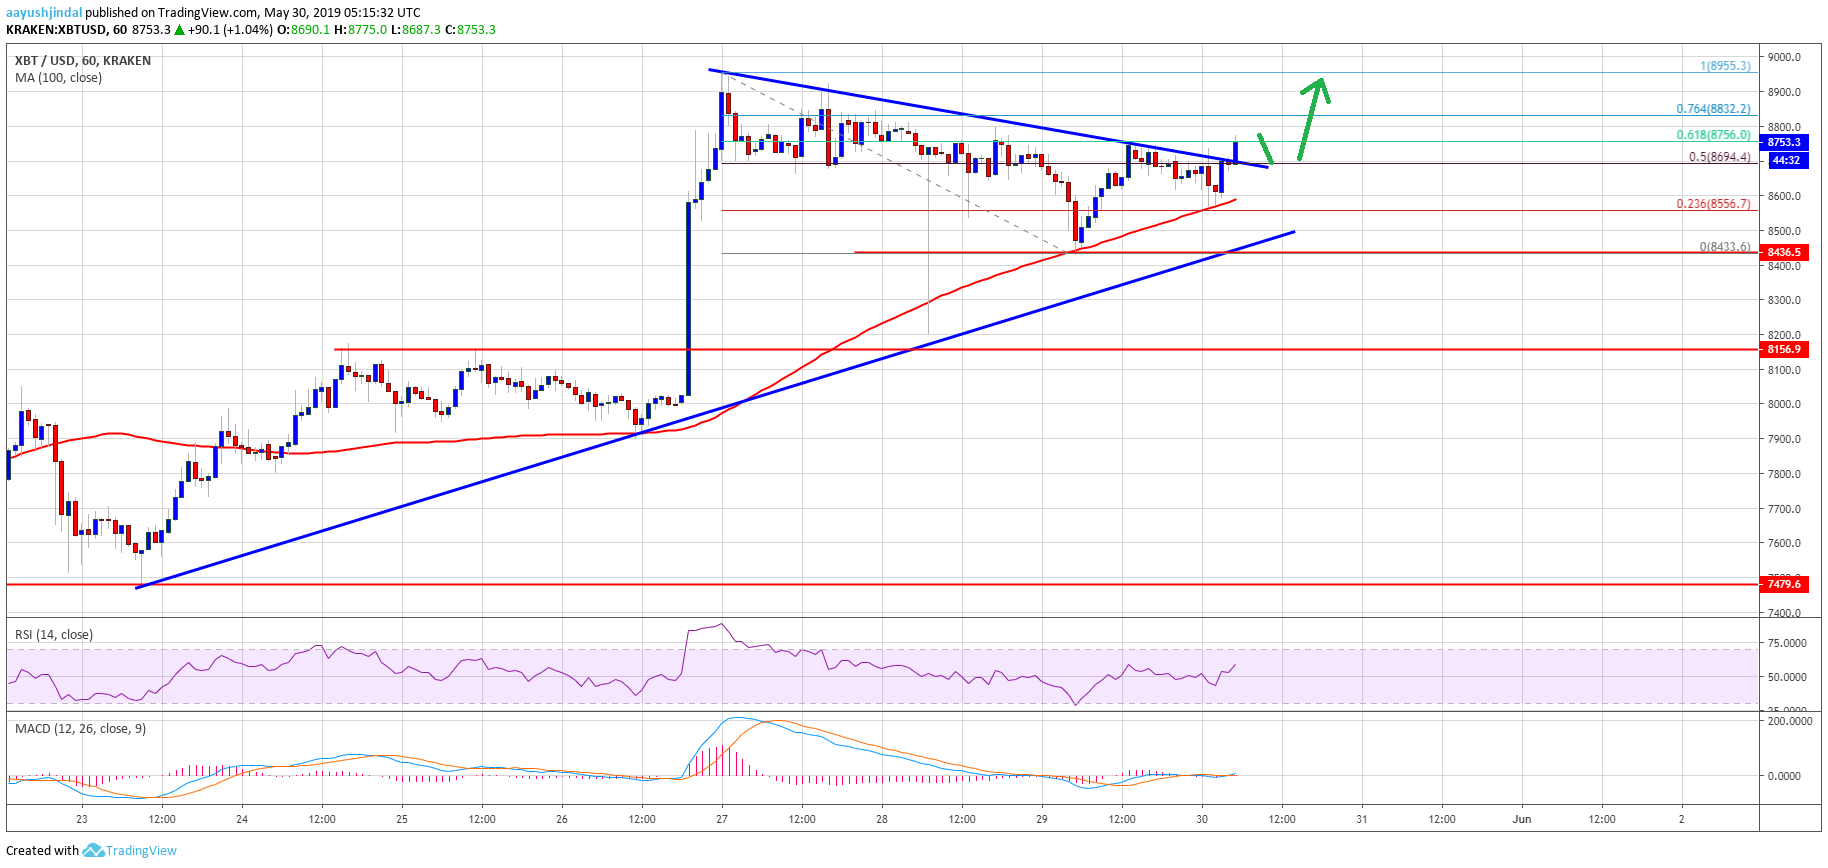
Looking at the chart, bitcoin price bounced back and completed a downside correction near $8,425. However, it must gain momentum above the $8,800 barrier to continue higher. The next important resistance is near $8,900. Above this, the price is likely to test the major $9,000 handle in the coming sessions.
Technical indicators:
Hourly MACD – The MACD is slowly gaining momentum in the bullish zone.
Hourly RSI (Relative Strength Index) – The RSI for BTC/USD is currently above the 50 level and it might continue higher towards 65.
Major Support Levels – $8,680 followed by $8,600.
Major Resistance Levels – $8,750, $8,800 and $8,900.


