Reason to trust
How Our News is Made
Strict editorial policy that focuses on accuracy, relevance, and impartiality
Ad discliamer
Morbi pretium leo et nisl aliquam mollis. Quisque arcu lorem, ultricies quis pellentesque nec, ullamcorper eu odio.
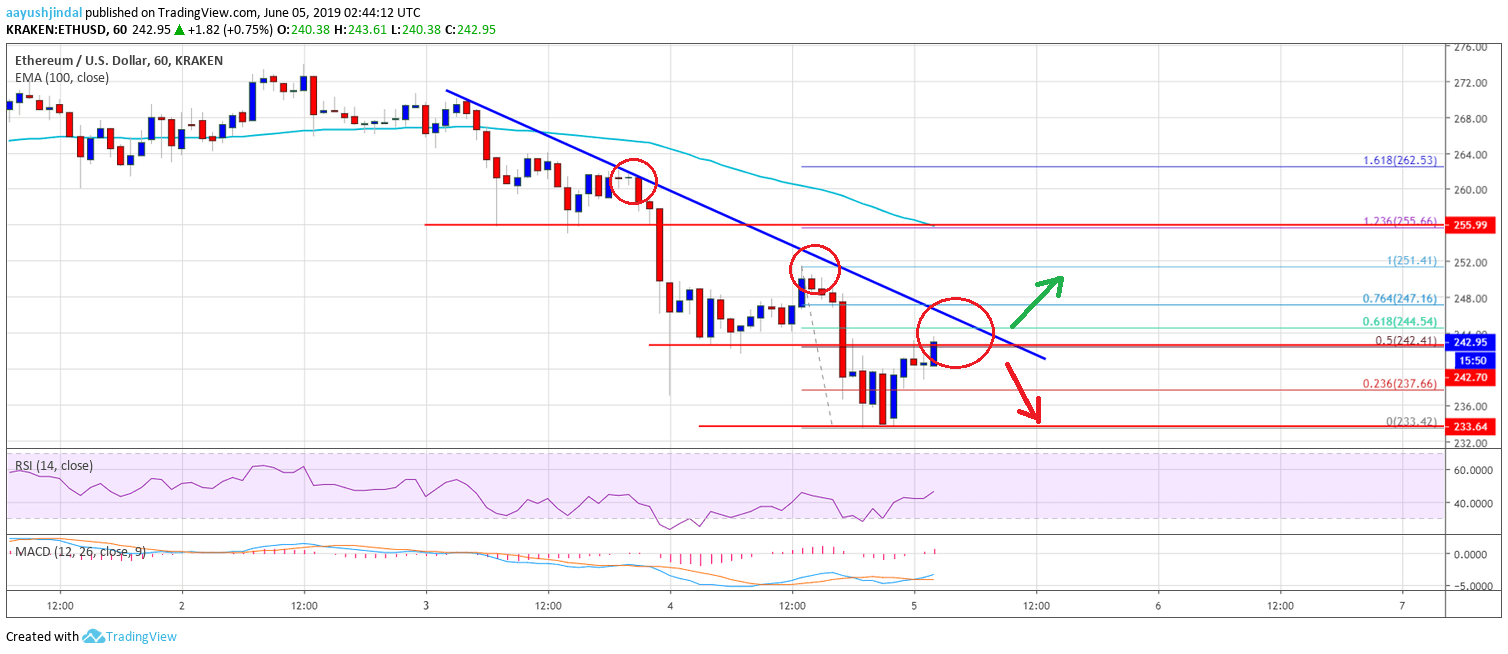
- ETH price started a steady decline and broke the $252 support area against the US Dollar.
- The price traded towards the $230 level and formed a new swing low at $233.
- There is a major bearish trend line forming with resistance near $246 on the hourly chart of ETH/USD (data feed via Kraken).
- The pair could either recover above $250 or decline again towards the $230 level.
Ethereum price moved into a bearish zone versus the US Dollar, but was stable vs bitcoin. ETH price is currently recovering higher, but it might face sellers near $250.
Ethereum Price Analysis
In the past two days, Ethereum price remained in a bearish zone below $265 against the US Dollar. The ETH/USD pair formed a couple of swing lows and declined below the $260 and $250 support levels. There was even a close below the $250 level and the 100 hourly simple moving average. The price traded below the $246 support level and formed a new weekly low near the $233 level. Recently, it started an upside correction above the $235 level and the 50% Fib retracement level of the downward move from the $252 high to $233 low.
However, there are many hurdles near the $244, $246 and $250 levels. Moreover, there is a major bearish trend line forming with resistance near $246 on the hourly chart of ETH/USD. The 61.8% Fib retracement level of the downward move from the $252 high to $233 low is also near the $244 level. Besides, the main resistance for the bulls is near the $250 level. Therefore, if there is an upside break above the trend line and $250, the price could recover further towards the $255 and $260 levels.
Conversely, if the price fails to break the $250 resistance, there is a risk of a fresh decline. An initial support is near the $240 level. If there is a downside break below $240, the price could move back towards the $233 swing low in the near term. Below $233, the price might continue to slide towards the $225 support area.
Looking at the chart, Ethereum price is clearly trading with bearish moves below the $250 level. Therefore, a proper close above the $250 barrier is needed for the bulls to gain control. The next key resistance is near the $255 level and the 100 hourly SMA, where sellers may emerge. Above $255, the price might test $260.
ETH Technical Indicators
Hourly MACD – The MACD for ETH/USD is slowly moving back in the bullish zone, with a few positive signs.
Hourly RSI – The RSI for ETH/USD is currently moving higher towards the 50 level.
Major Support Level – $240
Major Resistance Level – $250