
Reason to trust
How Our News is Made
Strict editorial policy that focuses on accuracy, relevance, and impartiality
Ad discliamer
Morbi pretium leo et nisl aliquam mollis. Quisque arcu lorem, ultricies quis pellentesque nec, ullamcorper eu odio.
- ETH price failed to gain momentum above $250 and $252 against the US Dollar.
- The price is currently well below $250 and it remains at a risk of more losses.
- There is a major bearish trend line forming with resistance at $248 on the 4-hours chart of ETH/USD (data feed via Kraken).
- The pair remains at a risk of more losses and it could accelerate below the $240 level.
Ethereum price is showing signs of weakness versus the US Dollar and bitcoin. ETH is likely to accelerate lower if it breaks the $240 and $235 support levels in the near term.
Ethereum Price Weekly Analysis
This past week, Ethereum price started a short term recovery from the $233 swing low against the US Dollar. The ETH/USD pair recovered above the $240 and $245 levels. There was a break above the 23.6% Fib retracement level of the last decline from the $274 swing high to $233 swing low. However, the price faced a strong resistance near the $250 and $252 resistance levels. Moreover, the 100 simple moving average (4-hours) also prevented gains and acted as a strong resistance.
Moreover, the 50% Fib retracement level of the last decline from the $274 swing high to $233 swing low also stopped upsides. More importantly, there is a major bearish trend line forming with resistance at $248 on the 4-hours chart of ETH/USD. The pair is now trading well below the trend line, $250, and the 100 simple moving average (4-hours). As long as the pair is below $250, it remains at a risk of more losses. An initial support is near the $240 level, below which the price could retest the $235 support.
If there are more losses, the price could decline sharply towards the $225 support. To start a decent recovery, the price must surpass the trend line, $250, and the 100 simple moving average (4-hours). A successful close above $250 could initiate a strong upward move towards the $255 and $260 levels. The next key resistance for the bulls is near the $270 level.
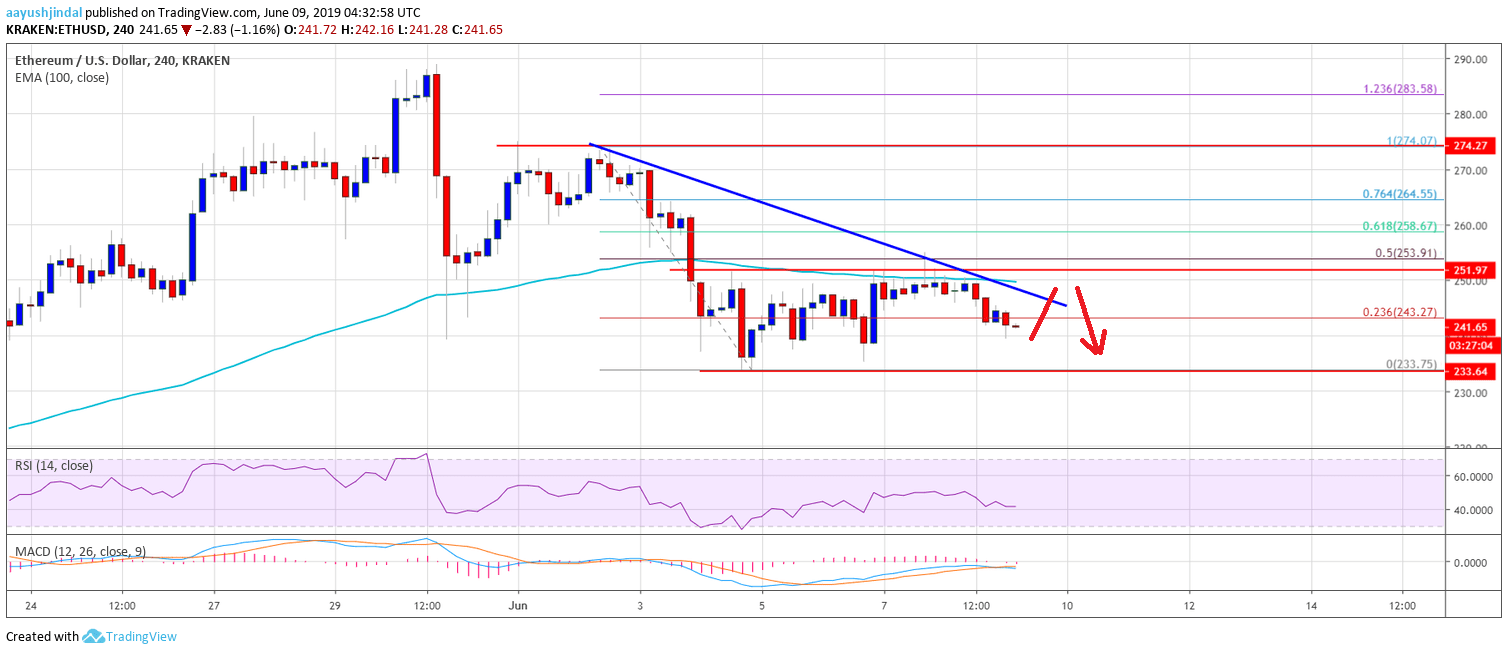
The above chart indicates that Ethereum price is facing a strong resistance near the $250 level and the 100 SMA. If the bulls continue to struggle, the price is likely to accelerate lower towards the $225 and $220 levels. On the upside, a clear break above $250 and $252 might start a strong upward move in the near term.
Technical Indicators
4 hours MACD – The MACD for ETH/USD is slowly moving in the bearish zone.
4 hours RSI – The RSI for ETH/USD is currently well below the 50 level and it could decline further below 40.
Major Support Level – $235
Major Resistance Level – $250


