
Reason to trust
How Our News is Made
Strict editorial policy that focuses on accuracy, relevance, and impartiality
Ad discliamer
Morbi pretium leo et nisl aliquam mollis. Quisque arcu lorem, ultricies quis pellentesque nec, ullamcorper eu odio.
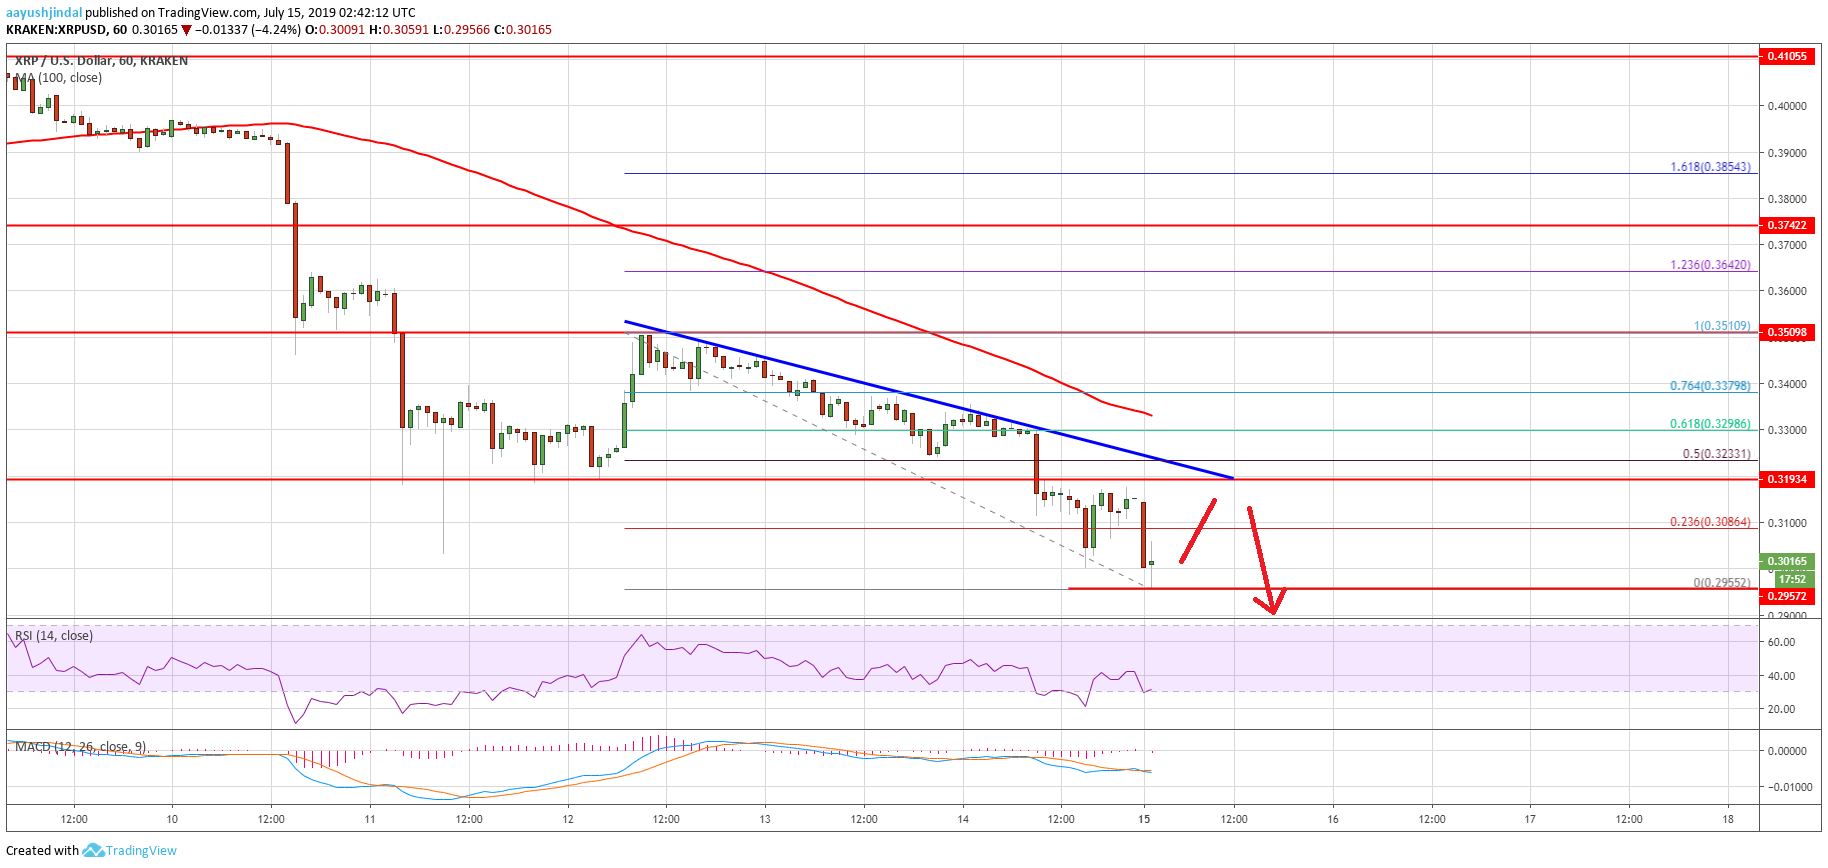
- Ripple price broke the key $0.3200 support level to extend losses against the US dollar.
- The price even spiked below the $0.3000 support area and traded to a new monthly low at $0.2955.
- There is a major bearish trend line forming with resistance at $0.3200 on the hourly chart of the XRP/USD pair (data source from Kraken).
- The price could correct higher, but it is likely to face sellers near $0.3150 and $0.3200.
Ripple price remained in a bearish zone against the US Dollar, but recovered vs bitcoin. XRP price might continue to decline and it is likely to test the $0.2850 support area.
Ripple Price Analysis
Recently, there were heavy losses in bitcoin and Ethereum, but ripple price declined less against the US Dollar. The XRP/USD pair remained in a bearish zone and broke the key $0.3200 support level. The pair even broke the $0.3000 support level and settled well below the 100 hourly simple moving average. Finally, the price traded to a new monthly low at $0.2955 and it is currently consolidating losses.
An immediate resistance on the upside is near the $0.3050 and $0.3080 levels. The 23.6% Fib retracement level of the recent decline from the $0.3510 high to $0.2955 low is also near the $0.3080 level. If there is an upside break above the $0.3080 level, the price could trade towards the $0.3200 resistance. The stated $0.3200 level was a support earlier and now it is likely to act as a strong resistance.
Moreover, there is a major bearish trend line forming with resistance at $0.3200 on the hourly chart of the XRP/USD pair. The 50% Fib retracement level of the recent decline from the $0.3510 high to $0.2955 low is the next resistance near the $0.3220 level. Therefore, to start a decent recovery, the price must move back above the $0.3200 and $0.3220 resistance level.
On the other hand, if the price fails to correct above $0.3200 or $0.3220, there could be more losses. An immediate support is near the $0.2950 level, below which the price may even break the $0.2900 level.
Looking at the chart, ripple price is clearly trading in a bearish zone below $0.3200 and the 100 hourly SMA. In the short term, there could be a minor upward move, but the bulls might struggle near the $0.3200 level. It seems like the price could extend losses and test the $0.2850 support level before a fresh recovery.
Technical Indicators
Hourly MACD – The MACD for XRP/USD is slowly losing momentum in the bearish zone.
Hourly RSI (Relative Strength Index) – The RSI for XRP/USD is currently well below the 40 level.
Major Support Levels – $0.2950, $0.2900 and $0.2850.
Major Resistance Levels – $0.3080, $0.3200 and $0.3220.


