
Reason to trust
How Our News is Made
Strict editorial policy that focuses on accuracy, relevance, and impartiality
Ad discliamer
Morbi pretium leo et nisl aliquam mollis. Quisque arcu lorem, ultricies quis pellentesque nec, ullamcorper eu odio.
- Bitcoin price failed to stay above the $11,000 level and resumed decline against the US Dollar.
- The price traded below the key $10,000 and $9,800 support levels to enter a bearish zone.
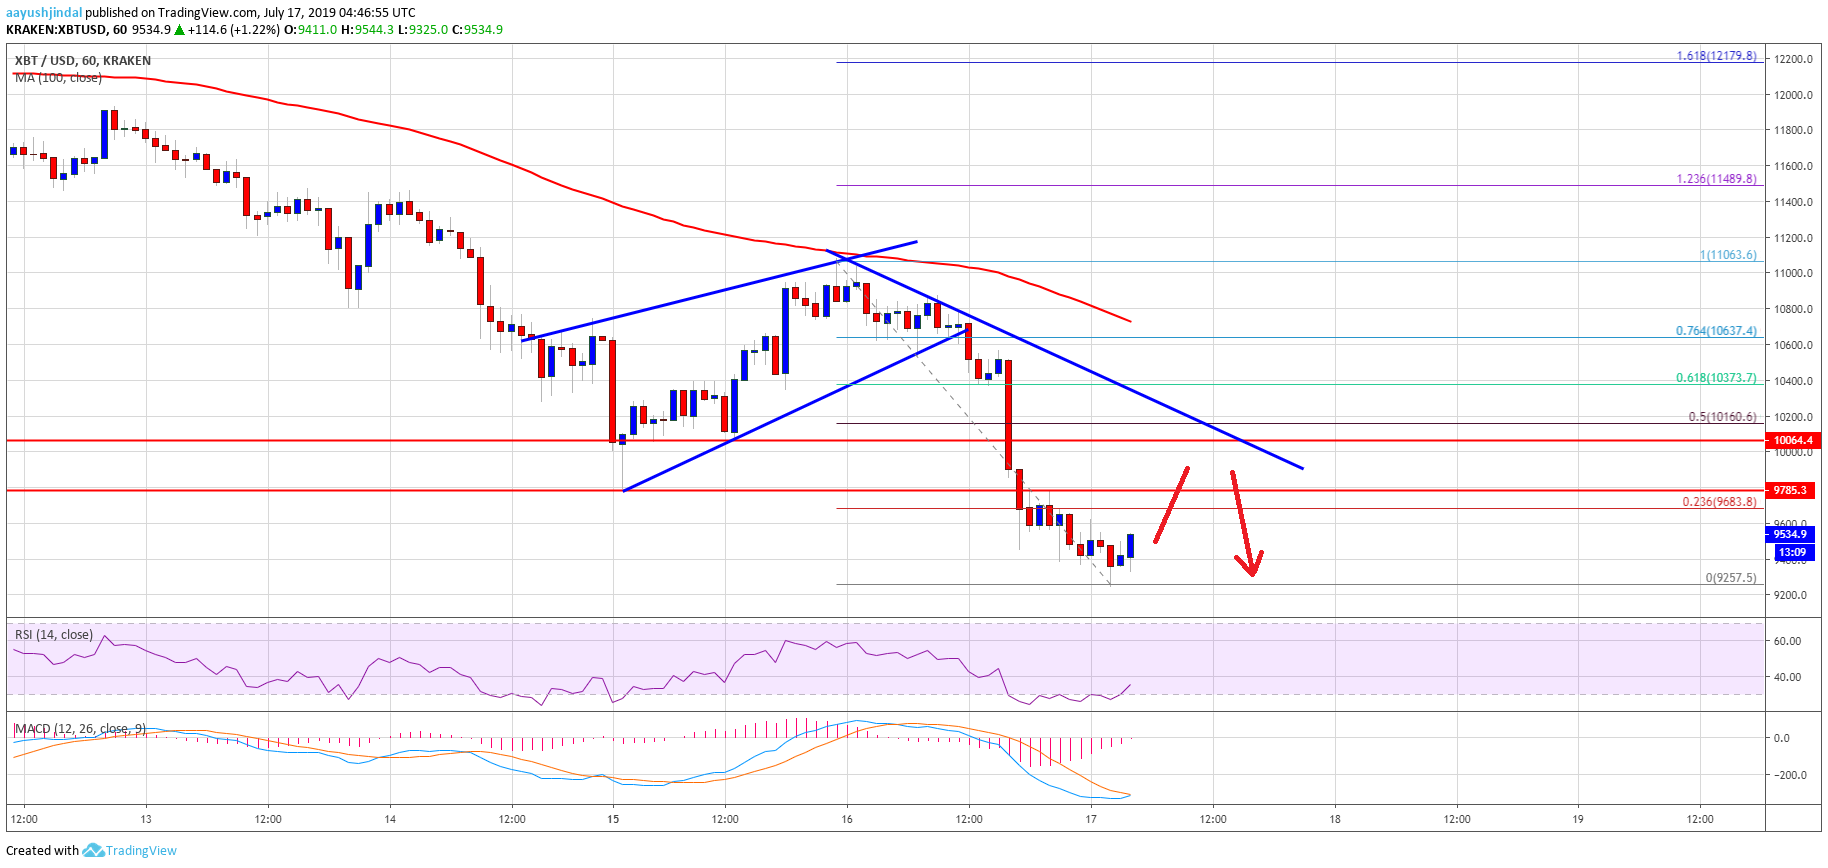
- There is a new connecting bearish trend line forming with resistance near $10,060 on the hourly chart of the BTC/USD pair (data feed from Kraken).
- The price remains at a risk of more losses below the $9,200 and $9,000 support levels in the near term.
Bitcoin price tumbled around 15% and broke the $9,500 level against the US Dollar. BTC remains at a risk of more losses and it seems like the $8,800 bearish target is still in sight.
Bitcoin Price Analysis
This week, we saw a major decline in bitcoin price below the $10,500 support against the US Dollar. The BTC/USD pair found support near $9,800 and yesterday corrected higher. It climbed above the $10,500 level, but struggled to gain momentum above the $11,000 level. A top was formed near the $11,100 level and the 100 hourly simple moving average. As a result, the price started a fresh decline below the $10,500 support level.
The decline was such that the price broke the $10,000 and $9,800 support levels. Moreover, the price declined close to 15% and traded as low as $9,257. It is currently consolidating above $9,300 and it might correct higher. An immediate resistance is near the $9,680 level plus the 23.6% Fib retracement level of the recent drop from the $11,063 high to $9,257 low. However, the main resistance is near the $10,000 and $10,100 levels.
Moreover, there is a new connecting bearish trend line forming with resistance near $10,060 on the hourly chart of the BTC/USD pair. The 50% Fib retracement level of the recent drop from the $11,063 high to $9,257 low is also near the $10,160 level to act as a strong resistance. Therefore, an upside recovery above the $9,650 level is likely to face a strong resistance near the $10,000 and $10,100 levels.
Conversely, if there is no recovery above $9,650 or $10,000, the price could continue to decline. An immediate support is near the $9,200 level, below which it could even break the $9,000 support zone. The main target could be $8,880 (as discussed in the weekly forecast when the price was well above $10,500).
Looking at the chart, bitcoin price is struggling below $10,000 and it could continue to weaken. However, once the current correction is complete near $8,880 or $8,800, the price may stage a decent recovery.
Technical indicators:
Hourly MACD – The MACD is about to move back in the bullish zone.
Hourly RSI (Relative Strength Index) – The RSI for BTC/USD is likely to correct higher towards the 40 level.
Major Support Levels – $9,200 followed by $9,000.
Major Resistance Levels – $9,650, $9,800 and $10,000.


