
Reason to trust
How Our News is Made
Strict editorial policy that focuses on accuracy, relevance, and impartiality
Ad discliamer
Morbi pretium leo et nisl aliquam mollis. Quisque arcu lorem, ultricies quis pellentesque nec, ullamcorper eu odio.
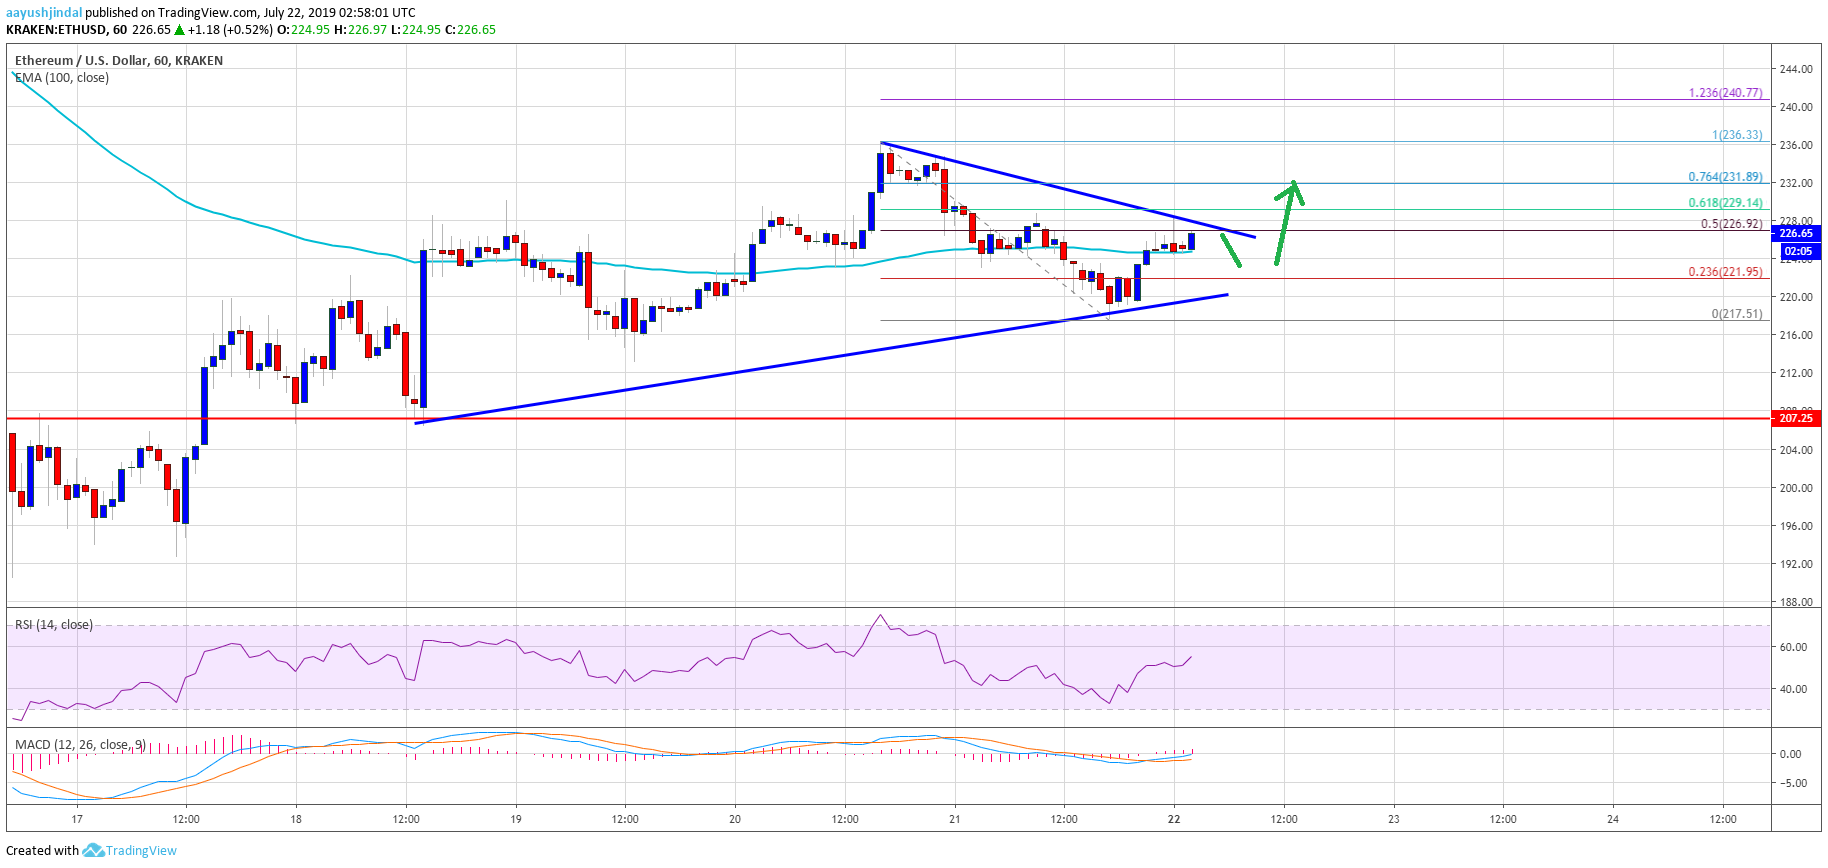
- ETH price remained well bid above the $208 support and recently climbed higher against the US Dollar.
- The price settled above the $220 pivot level and is currently consolidating in a range.
- There is a breakout pattern forming with resistance near $227 on the hourly chart of ETH/USD (data feed via Kraken).
- The pair is likely to accelerate higher above the $227 and $230 resistance levels in the near term.
Ethereum price is showing positive signs above $208 and $215 versus the US Dollar, similar to bitcoin. ETH price might continue to rise towards the $240 and $250 resistances.
Ethereum Price Analysis
After forming a support base above $200 and $208, Ethereum price climbed higher against the US Dollar. The ETH/USD pair even broke the $220 resistance and settled above the 100 hourly simple moving average. Recently, there was a break above the $230 level and the price traded to a new intraday high at $236. Later, it corrected lower and traded below the $225 level. A low was formed near $217 and the price is currently consolidating in a range.
It broke the $220 level plus the 23.6% Fib retracement level of the recent decline from the $236 high to $217 low. However, the price is struggling to clear the $227 and $230 resistance levels. Moreover, there is a breakout pattern forming with resistance near $227 on the hourly chart of ETH/USD. The 50% Fib retracement level of the recent decline from the $236 high to $217 low also acted as a barrier.
If there is an upside break above the $227 and $230 resistance levels, the price might continue to rise. The next key resistance is near the $236 high, above which the price could accelerate towards the $240 level. Any further gains could push the price towards the $250 resistance.
On the other hand, if the price fails to gain pace above $227 and $230, there could be a downside break. An immediate support is near the $217 low, below which the price might accelerate towards the $210 or $208 support area.
Looking at the chart, Ethereum price is clearly preparing for the next move either above $230 resistance or below the $217 swing low. If there is an upside break above $230, the price will most likely grind higher towards the $250 area. Conversely, it could revisit the $208 support area in the coming sessions.
ETH Technical Indicators
Hourly MACD – The MACD for ETH/USD is slowly gaining pace in the bullish zone, with positive signs.
Hourly RSI – The RSI for ETH/USD is currently well above the 50 level, with a bullish angle.
Major Support Level – $217
Major Resistance Level – $230


