Reason to trust
How Our News is Made
Strict editorial policy that focuses on accuracy, relevance, and impartiality
Ad discliamer
Morbi pretium leo et nisl aliquam mollis. Quisque arcu lorem, ultricies quis pellentesque nec, ullamcorper eu odio.
- Ripple price remained well supported on the downside near the $0.3200 level against the US dollar.
- The price traded higher and broke the $0.3250 and $0.3320 resistance levels.
- There is a key bullish trend line forming with support at $0.3265 on the hourly chart of the XRP/USD pair (data source from Kraken).
- The price is likely to continue higher, with chances of an upside break above $0.3350 and $0.3400.
Ripple price is trading with a bullish bias against the US Dollar, similar to bitcoin. XRP price is likely to climb higher towards the $0.3400 and $0.3500 resistance levels.
Ripple Price Analysis
After a successful daily close above $0.3000, ripple price started an upward move against the US Dollar. The XRP/USD pair broke the $0.3080 and $0.3120 resistance levels to move into a positive zone. Moreover, there was a close above the $0.3200 level and the 100 hourly simple moving average. Finally, the price broke the $0.3250 and $0.3320 resistance levels. A new intraday high was formed at $0.3418 and the price recently corrected lower.
It broke the $0.3350 and $0.3320 support levels. Moreover, there was a break below the 50% Fib retracement level of the last wave from the $0.3099 low to $0.3418 high. However, the decline was protected by the $0.3220 support area and the 100 hourly simple moving average. Besides, the 61.8% Fib retracement level of the last wave from the $0.3099 low to $0.3418 high also acted as a support.
More importantly, there is a key bullish trend line forming with support at $0.3265 on the hourly chart of the XRP/USD pair. The pair remains well supported above $0.3250 and the 100 hourly SMA. If there is a downside break below the $0.3250 support and the 100 hourly SMA, the price could accelerate downsides towards the $0.3200 and $0.3150 support levels.
On the upside, an immediate resistance is near the $0.3340 level. If there are more upsides, the price could continue to climb towards the $0.3400 and $0.3500 levels. An intermediate resistance is near the $0.3440 level.
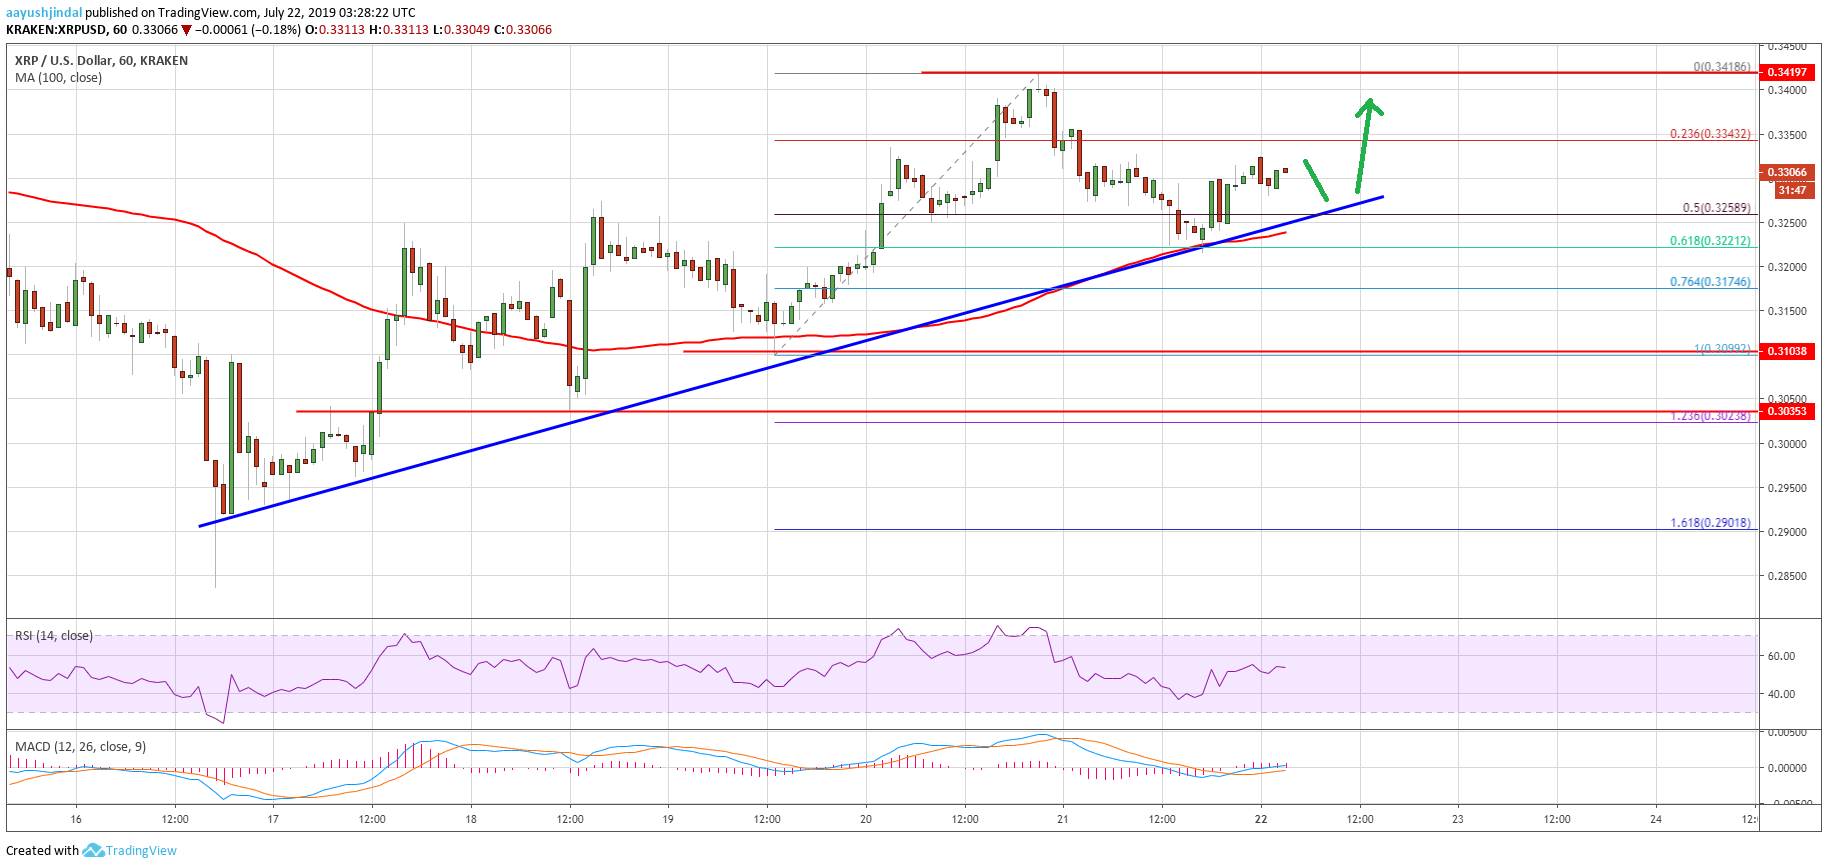
Looking at the chart, ripple price seems to be trading in a positive zone above the $0.3300 and $0.3250 support levels. As long as there is no close below $0.3250 plus the 100 hourly SMA, the price could continue to rise. On the upside, the first target for the bulls could be $0.3400, above which there are chances of a run to $0.3500.
Technical Indicators
Hourly MACD – The MACD for XRP/USD is slowly gaining pace in the bullish zone.
Hourly RSI (Relative Strength Index) – The RSI for XRP/USD is currently placed nicely above the 50 level.
Major Support Levels – $0.3260, $0.3220 and $0.3150.
Major Resistance Levels – $0.3400, $0.3440 and $0.3500.