
Reason to trust
How Our News is Made
Strict editorial policy that focuses on accuracy, relevance, and impartiality
Ad discliamer
Morbi pretium leo et nisl aliquam mollis. Quisque arcu lorem, ultricies quis pellentesque nec, ullamcorper eu odio.
- Bitcoin price struggled to recover above $10,400 and declined recently against the US Dollar.
- The price declined heavily and even broke the key $10,000 support level to enter a bearish zone.
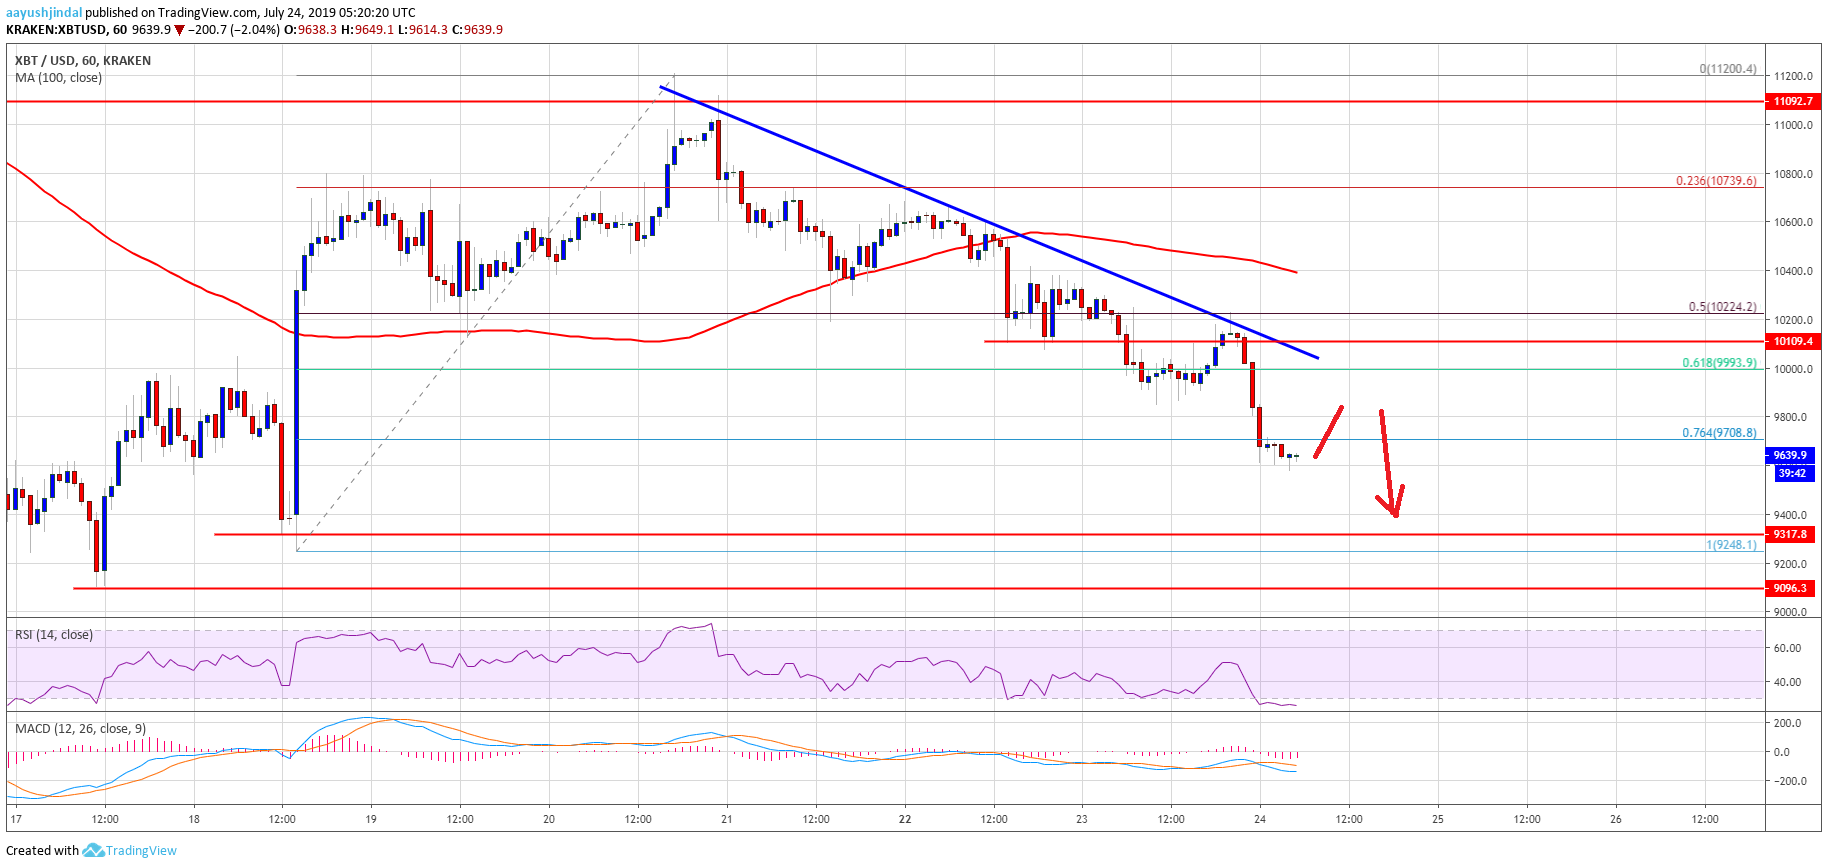
- Yesterday’s highlighted key bearish trend line is intact with resistance near $10,000 on the hourly chart of the BTC/USD pair (data feed from Kraken).
- The price is currently trading with a bearish angle and it could even test the $9,200 support area.
Bitcoin price is under pressure below the $10,000 support against the US Dollar. BTC price is likely to continue lower and it seems like the bears are eyeing a test of $9,200.
Bitcoin Price Analysis
In the past two days, there was a steady decline in bitcoin price from well above $10,500 against the US Dollar. The BTC/USD pair traded below the $10,200 and $10,000 support levels to enter a bearish zone. Moreover, there was a break below the 50% Fib retracement level of the upward move from the $9,248 low to $11,200 swing high. It opened the doors for more losses below the $10,000 support.
More importantly, the price settled below the $10,000 support and the 100 hourly simple moving average. At the outset, the price is trading below the $9,800 support. Moreover, the price even failed to stay above the 76.4% Fib retracement level of the upward move from the $9,248 low to $11,200 swing high. Therefore, there is a risk of more losses towards the $9,300 and $9,200 levels.
The last swing low near $9,248 might act as a support. However, if there are more losses below $9,248, the price may accelerate towards the $9,100 level. The next major support is near the $8,800 level. The 1.236 Fib extension level of the upward move from the $9,248 low to $11,200 swing high is also near $8,800. On the upside, there is a strong resistance forming near $9,950 and $10,000.
Besides, yesterday’s highlighted key bearish trend line is intact with resistance near $10,000 on the hourly chart of the BTC/USD pair. Therefore, a close above the $10,000 level might a short term recovery. The next major resistance is near the $10,400 level and the 100 hourly simple moving average. A successful close above $10,400 is needed for a fresh increase to $11,000.
Looking at the chart, bitcoin price is under a lot of pressure below $9,800 and it might continue to slide. Overall, it seems like the bears are eyeing a test of the last swing low near $9,248.
Technical indicators:
Hourly MACD – The MACD is gaining pace in the bearish zone.
Hourly RSI (Relative Strength Index) – The RSI for BTC/USD is now well below the 40 level, with bearish signs.
Major Support Levels – $9,500 followed by $9,248.
Major Resistance Levels – $10,000, $10,200 and $10,400.


