
Reason to trust
How Our News is Made
Strict editorial policy that focuses on accuracy, relevance, and impartiality
Ad discliamer
Morbi pretium leo et nisl aliquam mollis. Quisque arcu lorem, ultricies quis pellentesque nec, ullamcorper eu odio.
- ETH price found support near the $210 level and recently climbed higher against the US Dollar.
- The price broke the $215 resistance and it seems like there could be more gains in the near term.
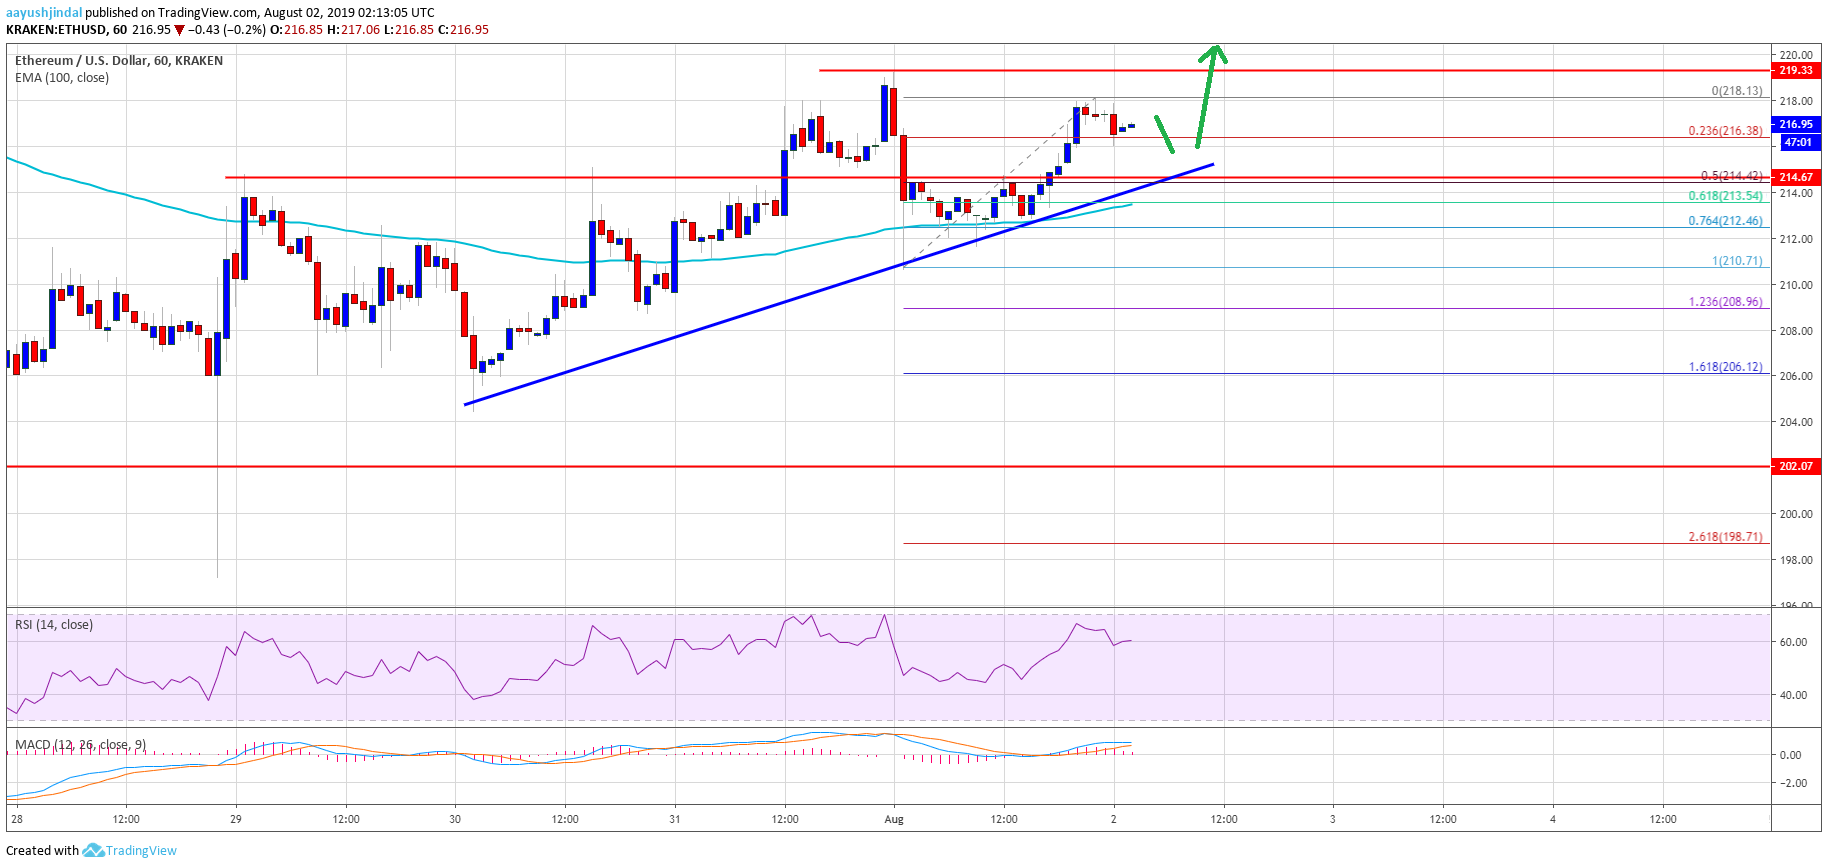
- There is a connecting bullish trend line forming with support near $214 on the hourly chart of ETH/USD (data feed via Kraken).
- The pair is currently trading with a bullish angle and it could even surpass the $220 resistance.
Ethereum price is trading with a positive bias versus the US Dollar, and bitcoin rallied above $10,200. ETH price may also gain traction and climb above the $220 resistance.
Ethereum Price Analysis
Yesterday, we discussed the importance of the $210 support for Ethereum price against the US Dollar. The ETH/USD pair corrected lower, but it stayed above the $210 support level. More importantly, there was no close below the 100 hourly simple moving average, and the price climbed back above the $215 level. Additionally, bitcoin price performed really well and climbed above the key $10,200 resistance.
Recently, ETH price climbed above the $216 level and formed a swing high at $218. It is currently struggling to continue higher above $218 and $220. An immediate support is near the $216 level plus the 23.6% Fib retracement level of the upward wave from the $210 low to $218 high. Moreover, there is a connecting bullish trend line forming with support near $214 on the hourly chart of ETH/USD.
The trend line support is near the 50% Fib retracement level of the upward wave from the $210 low to $218 high. Therefore, dips towards the $214 level might find a strong buying interest. The next major support is near the $212 level and the 100 hourly simple moving average. If there is a successful close below the 100 hourly SMA, the price could even break the $210 support level.
On the upside, the $218 level is an initial resistance. The main resistance is near the $220 level. If there is an upside break above the $220 resistance, the price could climb higher positively towards the $225 and $230 levels.
Looking at the chart, Ethereum price is trading with a positive bias above the $212 and $214 levels. Therefore, there are chances of more upsides above the $218 and $220 levels in the near term. Only a close below the 100 hourly SMA and $210 might negate the current bullish view.
ETH Technical Indicators
Hourly MACD – The MACD for ETH/USD is losing momentum in the bullish zone.
Hourly RSI – The RSI for ETH/USD is currently moving higher and is well above the 50 level.
Major Support Level – $210
Major Resistance Level – $220


