
Reason to trust
How Our News is Made
Strict editorial policy that focuses on accuracy, relevance, and impartiality
Ad discliamer
Morbi pretium leo et nisl aliquam mollis. Quisque arcu lorem, ultricies quis pellentesque nec, ullamcorper eu odio.
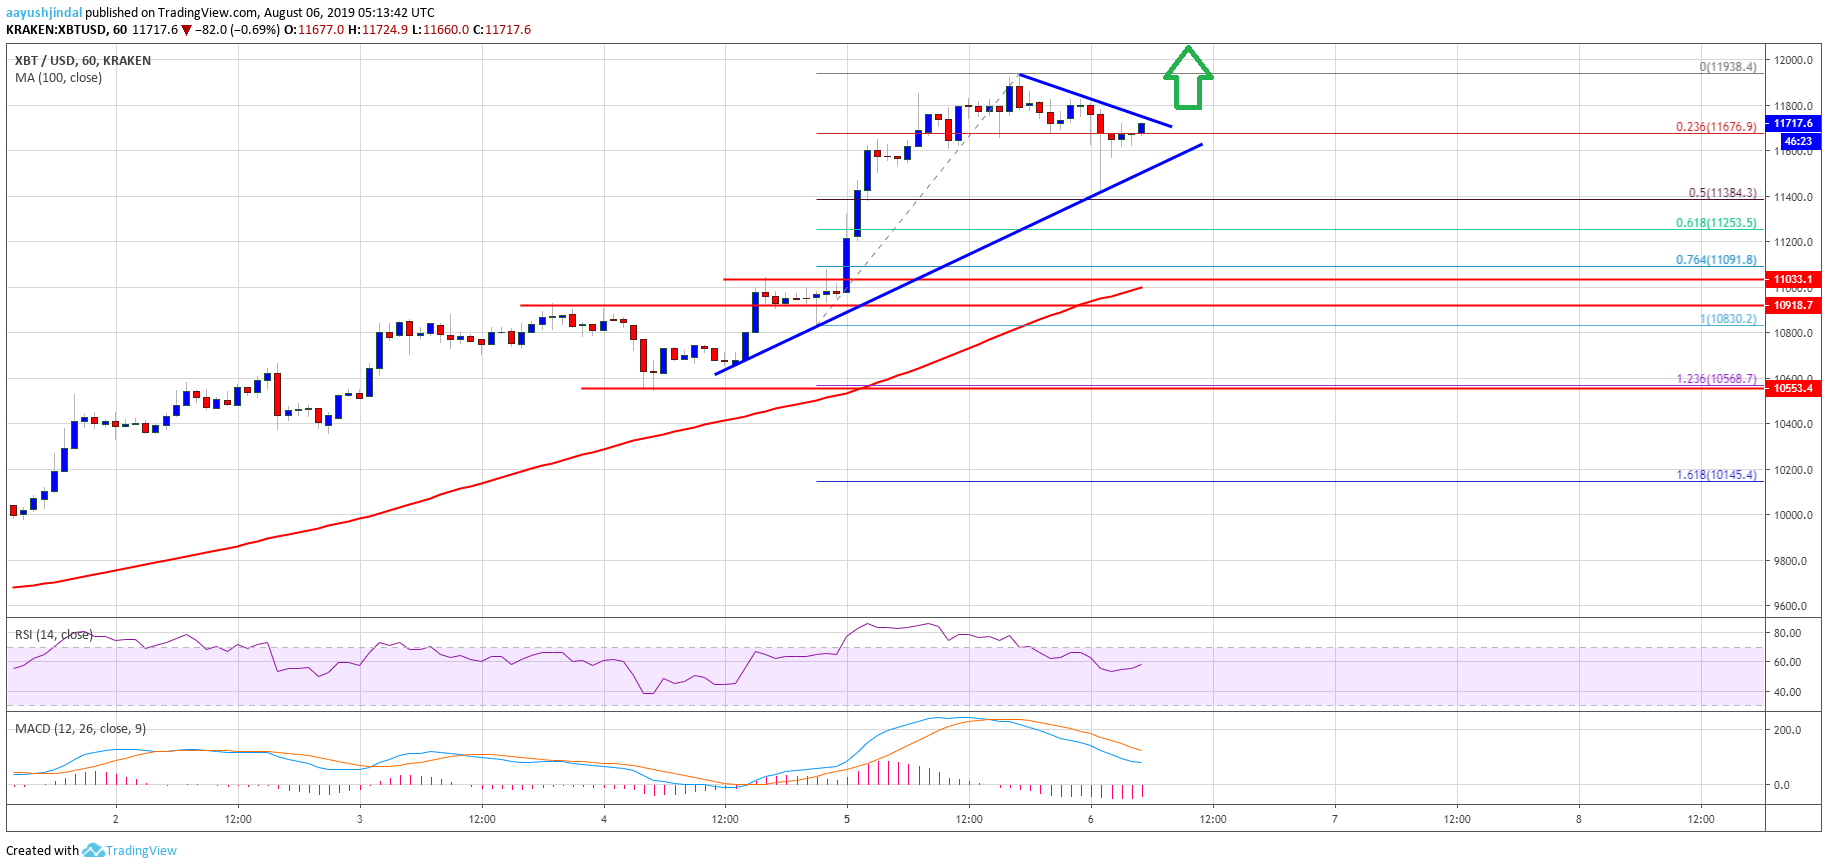
- Bitcoin price extended gains above the $11,500 and $11,700 resistances against the US Dollar.
- The price is currently correcting lower after trading close to the $12,000 resistance.
- There is a connecting bullish trend line forming with support near $11,540 on the hourly chart of the BTC/USD pair (data feed from Kraken).
- The price remains in an uptrend and it could surpass $12,000 to test the $12,200 level.
Bitcoin price is gaining bullish momentum above $11,500 against the US Dollar. BTC price might continue to climb higher towards $12,000 and $12,200 in the near term.
Bitcoin Price Analysis (BTC/USD)
Yesterday, we saw a solid upward move in bitcoin price above $11,200 against the US Dollar. The BTC/USD pair even broke the $11,500 resistance and settled above the 100 hourly simple moving average. Later, the price climbed above the $11,700 resistance and traded close to the $12,000 level. Finally, a swing high was formed near $11,938 and the price recently corrected lower.
It broke the $11,800 level plus the 23% Fib retracement level of the recent wave from the $10,830 low to $11,938 high. However, the decline found support near the $11,400 level. Moreover, there was no close below the $11,500 support level. At the moment, the price is trading nicely above the 50% Fib retracement level of the recent wave from the $10,830 low to $11,938 high.
More importantly, there is a connecting bullish trend line forming with support near $11,540 on the hourly chart of the BTC/USD pair. If there is a downside break below the trend line support and $11,500, there could be an extended correction. Additionally, the next major support is near the $11,250 level. It represents the 61.8% Fib retracement level of the recent wave from the $10,830 low to $11,938 high.
On the upside, an immediate resistance is near the $11,800 level. Moreover, there is a connecting bearish trend line near $11,800 on the same chart. Therefore, a successful break above $11,800 might set the pace for more upsides above the $11,900 and $12,000 levels. Additionally, the next key resistance above $12,000 is near the $12,200 level.
Looking at the chart, bitcoin price is clearly trading in a nice uptrend above $11,500 with a strong technical bias. Thus, if there are more upsides, the price could easily hit the $12,200 resistance level. Conversely, a downside break below the $11,250 support might push the price back towards the $10,800 support area.
Technical indicators:
Hourly MACD – The MACD is likely to move back into the bullish zone.
Hourly RSI (Relative Strength Index) – The RSI for BTC/USD is currently well above the 50 level, with a bullish angle.
Major Support Levels – $11,500 followed by $11,250.
Major Resistance Levels – $11,800, $12,000 and $12,200.


