
Reason to trust
How Our News is Made
Strict editorial policy that focuses on accuracy, relevance, and impartiality
Ad discliamer
Morbi pretium leo et nisl aliquam mollis. Quisque arcu lorem, ultricies quis pellentesque nec, ullamcorper eu odio.
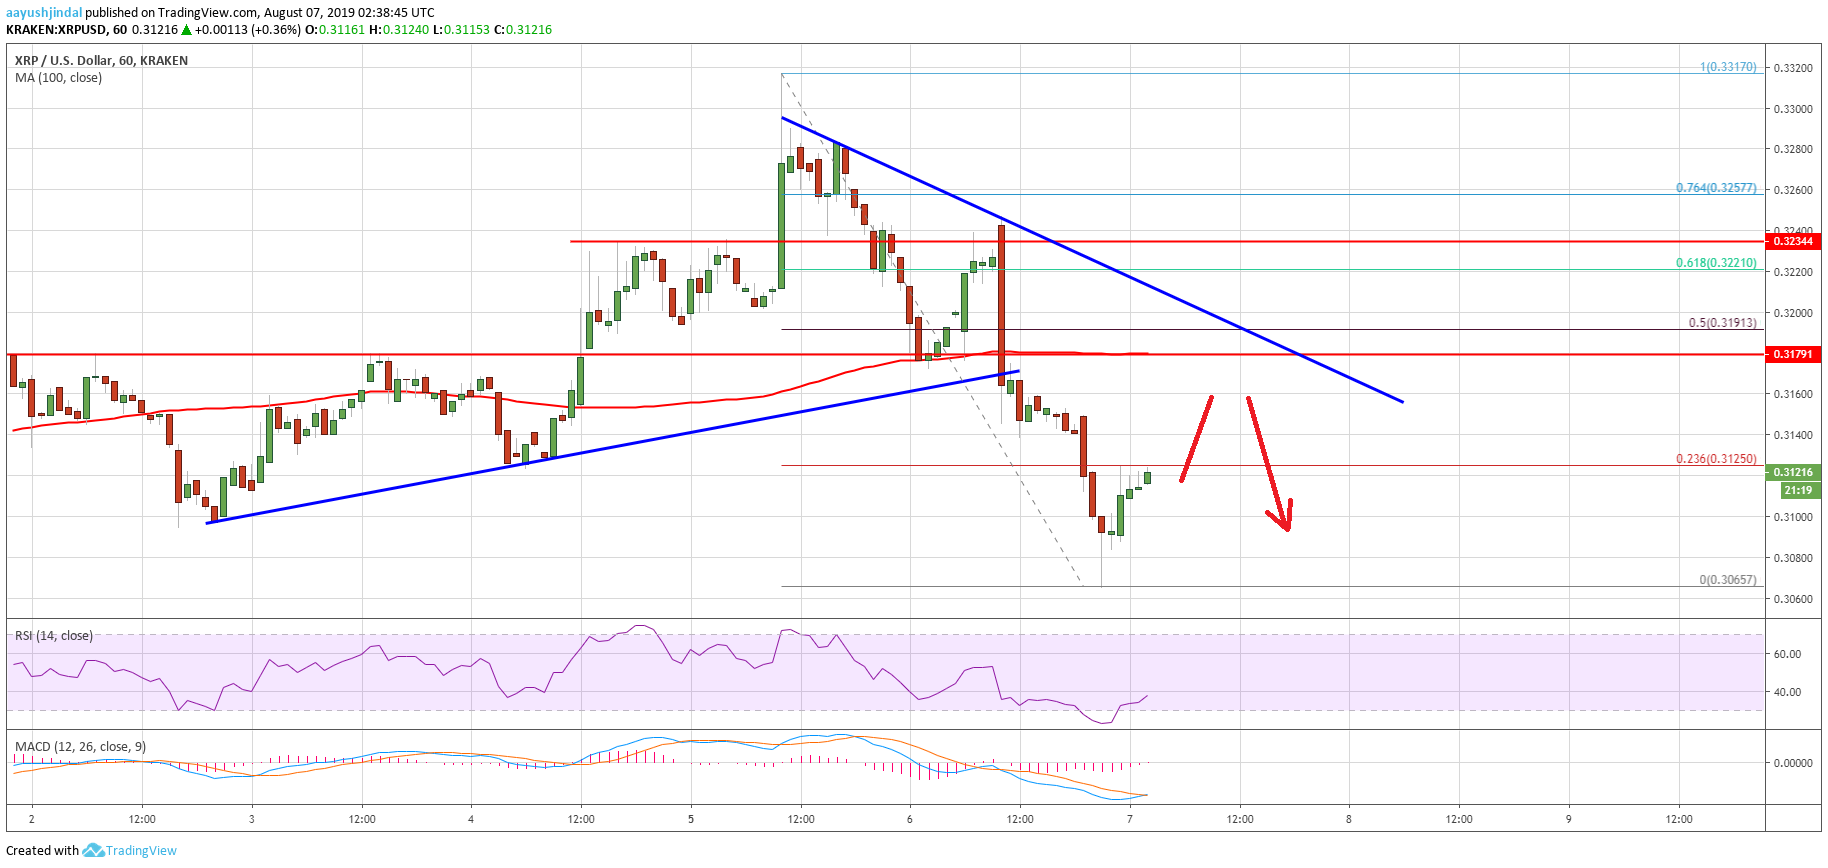
- Ripple price traded close to the $0.3320 resistance level before declining sharply against the US dollar.
- The price is currently correcting higher after it traded as low as $0.3065.
- There is a key resistance forming near $0.3180 and a bearish trend line on the hourly chart of the XRP/USD pair (data source from Kraken).
- The price might correct higher, but it is likely to struggle near the $0.3180 and $0.3200 resistances.
Ripple price is facing a lot of hurdles against the US Dollar, while bitcoin is holding an important support. XRP price is likely to face a strong selling interest near the $0.3200 resistance area.
Ripple Price Analysis
Recently, there was a decent rise in ripple price above the $0.3220 resistance against the US Dollar, coupled with gains in Ethereum and bitcoin. The XRP/USD pair climbed above the $0.3300 level and the 100 hourly simple moving average. However, the bulls failed to clear the $0.3320 resistance area. A swing high was formed near $0.3317 and the price started a sharp decline.
There was a break below the $0.3250 and $0.3220 support levels. Moreover, the price broke the key $0.3200 support and the 100 hourly simple moving average. Finally, the price dived below the $0.3100 level and traded as low as $0.3065. It is currently correcting higher above $0.3100. An immediate resistance is near the $0.3125 level. Additionally, the 23.6% Fib retracement level of the recent decline from the $0.3317 high to $0.3065 low is also near the $0.3125 level.
On the upside, the main resistance is near the $0.3180 level. More importantly, there is a key resistance forming near $0.3180 and a bearish trend line on the hourly chart of the XRP/USD pair. The 100 hourly SMA is also near the $0.3180 level to act as a resistance. Furthermore, the 50% Fib retracement level of the recent decline from the $0.3317 high to $0.3065 low is at $0.3191.
Therefore, the price is likely to face a lot of resistance near the $0.3180 and $0.3200 levels. A successful close above $0.3200 is needed for a fresh increase above $0.3220 in the near term.
Looking at the chart, ripple price seems to be back below a few important supports such as $0.3220 and $0.3200. As long as there is no close above $0.3200, the price could struggle to gain bullish momentum. On the downside, the key supports are near $0.3080, $0.3065 and $0.3020.
Technical Indicators
Hourly MACD – The MACD for XRP/USD is about to move into the bullish zone.
Hourly RSI (Relative Strength Index) – The RSI for XRP/USD is currently climbing higher towards the 50 level.
Major Support Levels – $0.3080, $0.3065 and $0.3020.
Major Resistance Levels – $0.3180, $0.3200 and $0.3220.


