Reason to trust
How Our News is Made
Strict editorial policy that focuses on accuracy, relevance, and impartiality
Ad discliamer
Morbi pretium leo et nisl aliquam mollis. Quisque arcu lorem, ultricies quis pellentesque nec, ullamcorper eu odio.
- Ripple price struggled to continue higher and declined below the $0.3100 level against the US dollar.
- The price is currently consolidating losses after it traded as low as $0.3038.
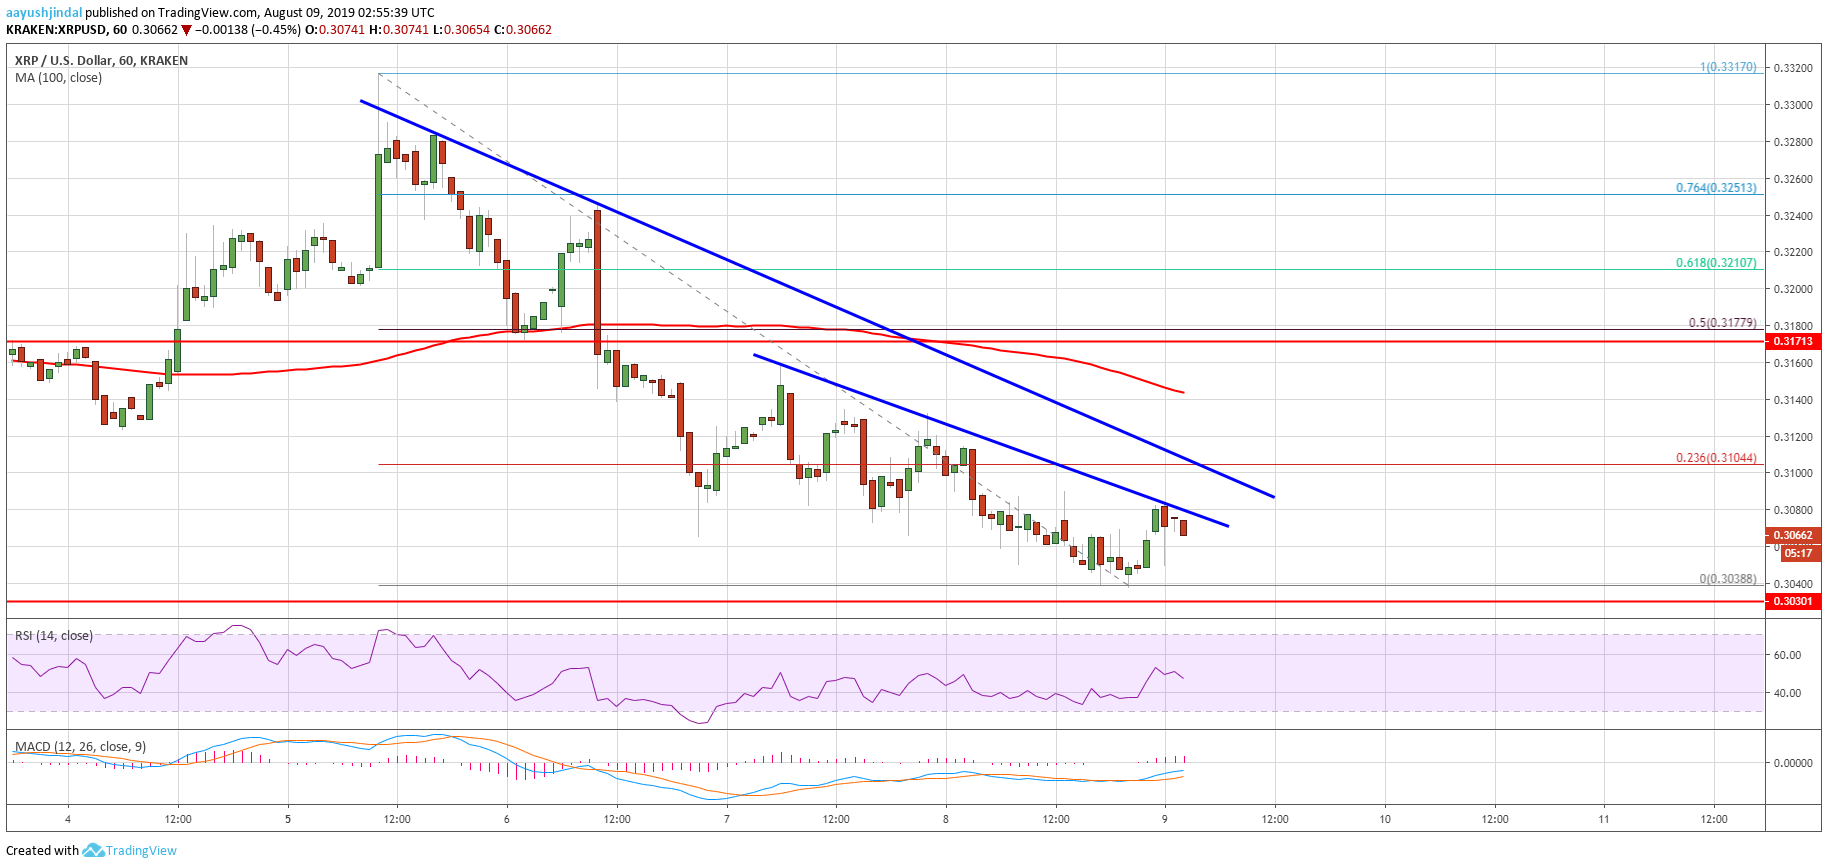
- There are two key bearish trend lines forming with resistance near $0.3100 on the hourly chart of the XRP/USD pair (data source from Kraken).
- The pair remains at a risk of more downsides as long as there is no close above $0.3120.
Ripple price is trading with a bearish below key supports against the US Dollar and bitcoin. XRP price might soon test the $0.3000 support level if the bears remain in action.
Ripple Price Analysis
After topping near the $0.3320 resistance, ripple price declined steadily against the US Dollar. Ethereum price also declined recently below the $220 support, but bitcoin price remained stable near $11,800. The XRP/USD pair is following a bearish path and it recently broke the $0.3200 and $0.3120 support levels. Moreover, there was a break below the $0.3080 support. Finally, the price settled below the 100 hourly simple moving average and a swing low was formed near $0.3038.
At the moment, the price is correcting higher towards the $0.3080 level. However, there are many resistances near the $0.3080 and $0.3100 levels. Moreover, the 23.6% Fib retracement level of the main decline from the $0.3317 high to $0.3038 low is also near $0.3104. More importantly, there are two key bearish trend lines forming with resistance near $0.3100 on the hourly chart of the XRP/USD pair.
Above the second trend line, the next resistance is near the $0.3120 level. However, the main resistances are near $0.3150, the 100 hourly SMA, and the $0.3180 level. Additionally, the 50% Fib retracement level of the main decline from the $0.3317 high to $0.3038 low is near the $0.3177 level to act as a resistance. Therefore, ripple bulls might struggle to push the price above the $0.3100 and $0.3120 resistance levels.
On the downside, the $0.3040 level is an immediate support. If there is a downside break below $0.3040, the price could test the $0.3000 support area. Any further losses may perhaps lead the price towards the $0.2920 support.
Looking at the chart, ripple price is clearly trading in a bearish zone below the $0.3120 and $0.3150 resistance levels. Therefore, the price is likely to decline further below $0.3040 unless there is a successful break above the $0.3150 resistance area.
Technical Indicators
Hourly MACD – The MACD for XRP/USD is currently moving in the bullish zone.
Hourly RSI (Relative Strength Index) – The RSI for XRP/USD is likely to move above the 50 level.
Major Support Levels – $0.3080, $0.3100 and $0.3120.
Major Resistance Levels – $0.3040, $0.3000 and $0.2920.