Reason to trust
How Our News is Made
Strict editorial policy that focuses on accuracy, relevance, and impartiality
Ad discliamer
Morbi pretium leo et nisl aliquam mollis. Quisque arcu lorem, ultricies quis pellentesque nec, ullamcorper eu odio.
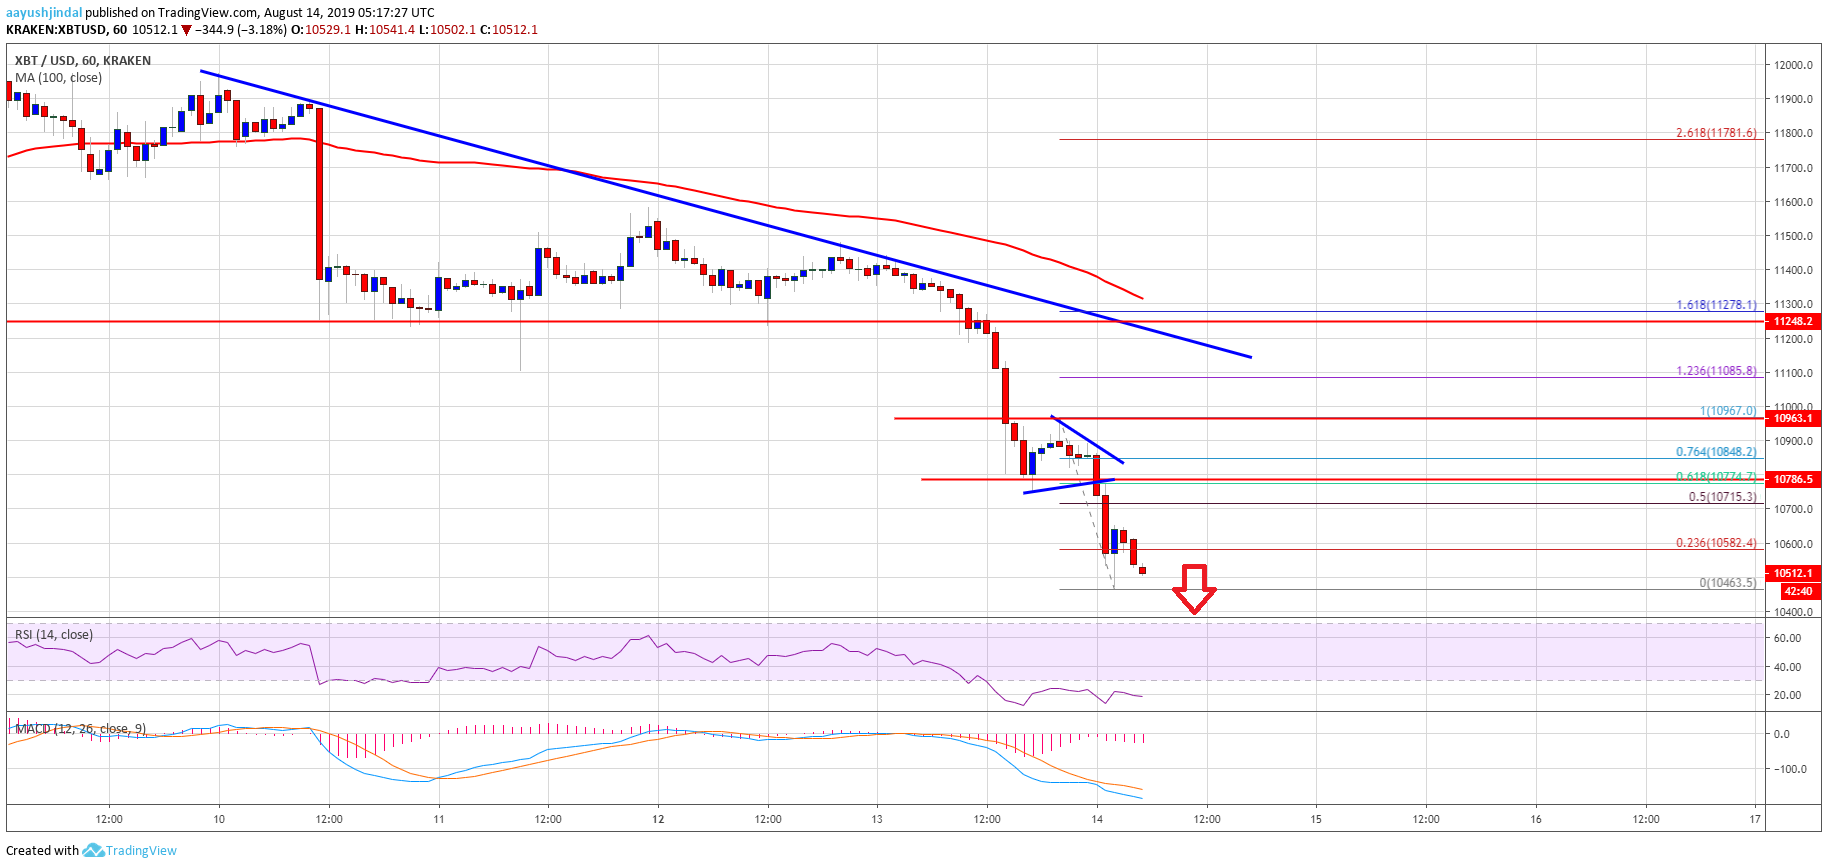
- Bitcoin price broke the key $11,200 support level and declined below $11,000 against the US Dollar.
- The price tested the $10,500 bearish target (as discussed in the weekly forecast).
- There is a major bearish trend line forming with resistance near $11,200 on the hourly chart of the BTC/USD pair (data feed from Kraken).
- The price remains at a risk of more losses below the $10,500 and $10,320 levels.
Bitcoin price is gaining bearish momentum below $11,000 against the US Dollar. BTC price tested the weekly bearish target of $10,500 and it could continue to weaken.
Bitcoin Price Analysis
In the bitcoin price weekly forecast, we discussed the chances of a drop to $10,500 against the US Dollar. The BTC/USD pair did follow a bearish path this week below $11,500 and 100 hourly simple moving average. As a result, there was a bearish break below the $11,200 and $11,000 support levels. Moreover, the price weakened more than 6% today and even broke the $10,800 support area.
Finally, it spiked below the $10,500 level and traded to a new weekly low at $10,463. It is currently consolidating losses above $10,500. An immediate resistance is near $10,580 plus the 23.6% Fib retracement level of the recent decline from the $10,967 high to $10,463 low. On the upside, the first key resistance is near the $10,720 level. It represents the 50% Fib retracement level of the recent decline from the $10,967 high to $10,463 low.
If there is an upside break above the $10,700 and $10,800 levels, the price could correct higher towards the $11,000 level. The next hurdle could be $11,080 plus the 1.236 Fib extension level of the recent decline from the $10,967 high to $10,463 low. Moreover, there is a major bearish trend line forming with resistance near $11,200 on the hourly chart of the BTC/USD pair.
The main resistance is near the $11,200 level (this week’s support area). On the downside, an immediate support is near the $10,450 level. If there is a bearish break, the price could slide further towards the $10,200 level. The main support is near the $10,000 level, where the bulls might take a stand.
Looking at the chart, bitcoin price is gaining bearish momentum below $11,000 and $10,800. Therefore, there are chances of more downsides below $10,500 and $10,450. Conversely, if there is an upside correction, the price is likely to face resistance near the $10,700 and $10,800 levels.
Technical indicators:
Hourly MACD – The MACD is currently placed in the bearish zone.
Hourly RSI (Relative Strength Index) – The RSI for BTC/USD is currently correcting higher from the 20 level.
Major Support Levels – $10,450 followed by $10,200.
Major Resistance Levels – $10,700, $10,800 and $11,000.