
Reason to trust
How Our News is Made
Strict editorial policy that focuses on accuracy, relevance, and impartiality
Ad discliamer
Morbi pretium leo et nisl aliquam mollis. Quisque arcu lorem, ultricies quis pellentesque nec, ullamcorper eu odio.
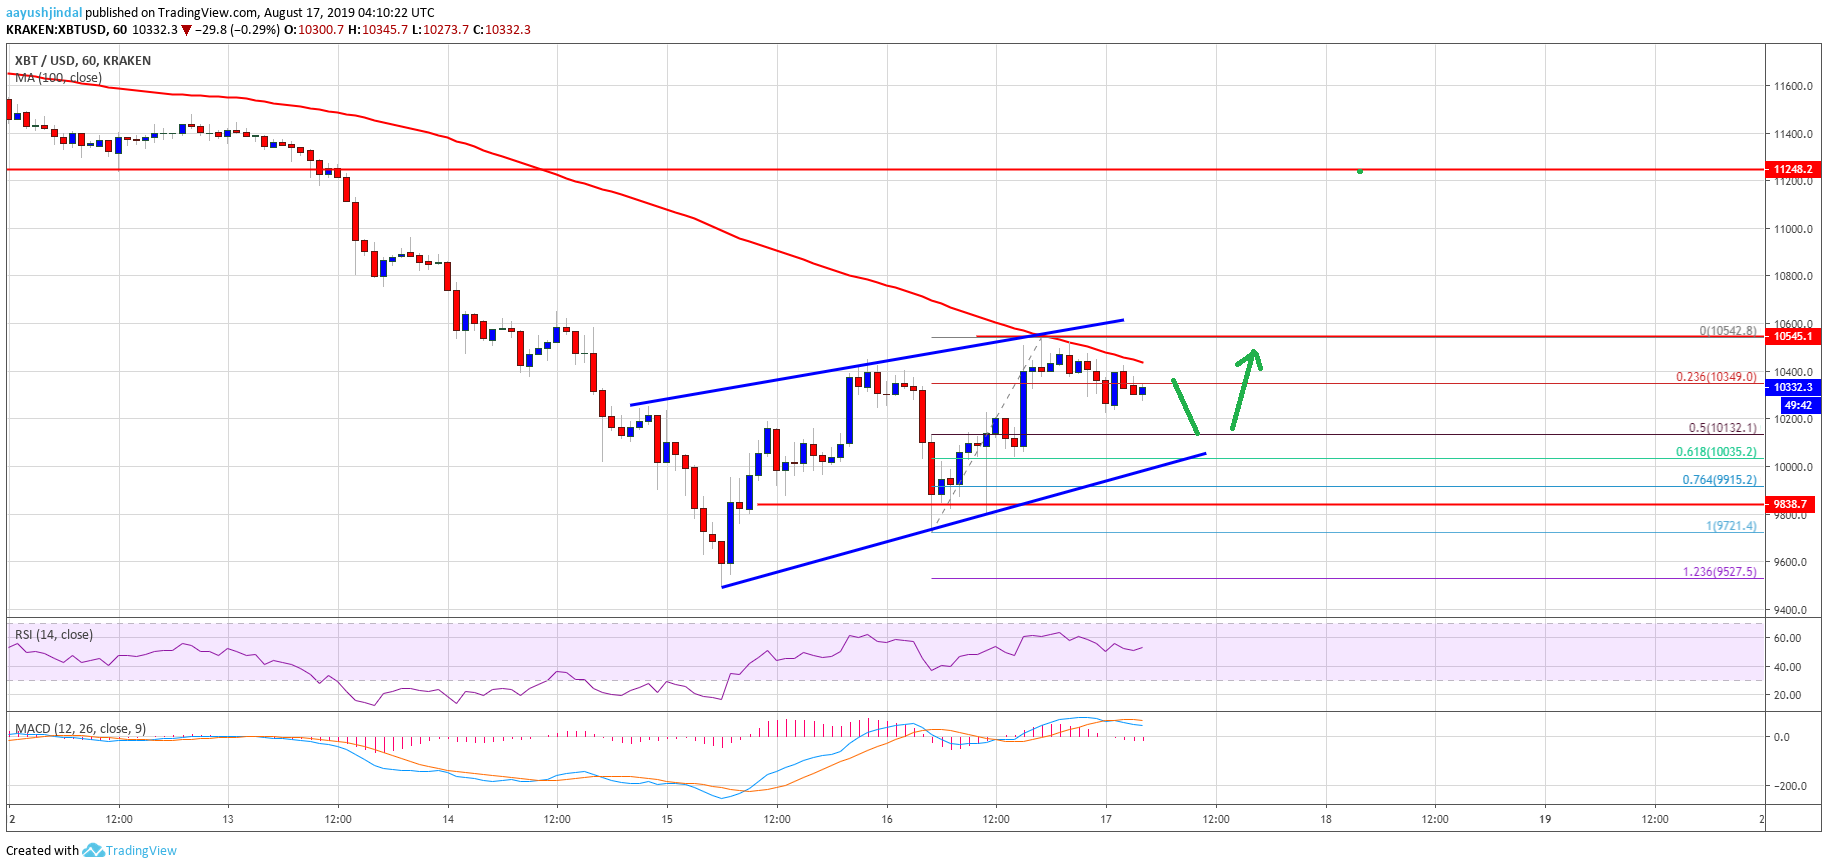
- Bitcoin price tested the $9,800 support and bounced back against the US Dollar.
- The price is currently struggling to gain momentum above $10,400 and $10,500.
- There is a key contracting triangle forming with resistance near $10,550 on the hourly chart of the BTC/USD pair (data feed from Kraken).
- The price is likely to slowly rise as long as it is trading above the $9,800 support area.
Bitcoin price is showing positive signs above the $9,800 support against the US Dollar. BTC price might gain bullish momentum once it settles above the $9,500 resistance.
Bitcoin Price Analysis
In yesterday’s analysis, we discussed the chances of another pullback in bitcoin price below the $10,000 level against the US Dollar. The BTC/USD pair did move below the $10,000 support and remained well below the 100 hourly simple moving average. Moreover, there was a break below the $9,960 support area, but the $9,800 level acted as a strong support. A swing low was formed near $9,721 and the price started a fresh increase.
There was a recovery above the $10,000 and $10,200 resistance levels. Moreover, the price broke the $10,400 resistance level. However, the price struggled to gain bullish momentum above the $10,500 level. More importantly, the price struggled to surpass the 100 hourly simple moving average, which is currently at $10,450. Besides, there is a key contracting triangle forming with resistance near $10,550 on the hourly chart of the BTC/USD pair.
An immediate support on the downside is near the $10,130 level. It represents the 50% Fib retracement level of the recent wave from the $9,721 low to $10,542 high. However, the main supports are near the $10,000 and $9,950 levels. Additionally, the 61.8% Fib retracement level of the recent wave from the $9,721 low to $10,542 high will most likely act as a support near $10,035.
On the upside, the price must gain momentum above the $10,400 and $10,500 resistance levels. Moreover, a successful close above the 100 hourly SMA could start a strong rise towards the $10,600 and $10,800 levels. Conversely, if the price starts a fresh decline and breaks the $10,000 support, the next key support is near the $9,800 level.
Looking at the chart, bitcoin price is clearly showing a few positive signs above the $10,000 level. Having said that, the bulls need to gain momentum above the 100 hourly SMA and $10,450 to push the price further higher in the near term.
Technical indicators:
Hourly MACD – The MACD is currently moving in the bearish zone.
Hourly RSI (Relative Strength Index) – The RSI for BTC/USD is currently above the 50 level.
Major Support Levels – $10,030 followed by $9,800.
Major Resistance Levels – $10,400, $10,500 and $10,650.


