Reason to trust
How Our News is Made
Strict editorial policy that focuses on accuracy, relevance, and impartiality
Ad discliamer
Morbi pretium leo et nisl aliquam mollis. Quisque arcu lorem, ultricies quis pellentesque nec, ullamcorper eu odio.
- ETH price declined heavily below the key $200 and $190 support levels against the US Dollar.
- The price is currently consolidating losses after trading as low as $174.
- There is a crucial bearish trend line forming with resistance near $195 on the 4-hours chart of ETH/USD (data feed via Kraken).
- The pair could start a strong upward move once it breaks the $195 and $200 resistance levels.
Ethereum price is currently consolidating losses against the US Dollar and bitcoin. ETH price could either climb above $195 and $200 or it might resume its decline.
Ethereum Price Weekly Analysis
This past week, bitcoin and Ethereum declined heavily below $10,000 and $200 respectively against the US Dollar. The ETH/USD pair even broke the $190 support and settled well below the 100 simple moving average (4-hours). Finally, there was a push below the $185 support level and the price traded as low as $174. Recently, it started an upside correction and recovered above the $180 level.
Moreover, there was a break above the 23.6% Fib retracement level of the last major decline from the $217 high to $174 swing low. However, there are many resistances on the upside near the $192, $195 and $200 levels. Additionally, there is a crucial bearish trend line forming with resistance near $195 on the 4-hours chart of ETH/USD. The trend line coincides with the 50% Fib retracement level of the last major decline from the $217 high to $174 swing low.
The most important resistance is near the $200 and $202 levels (the previous supports). Therefore, a successful break above the $195 resistance plus a follow through above $200 is needed for a fresh increase. The next key resistance is near the $207 level and the 100 simple moving average (4-hours). Besides, the 76.4% Fib retracement level of the last major decline from the $217 high to $174 swing low is also near $207.
Conversely, if there is no upside break above $195 or $200, the price could resume its decline. An immediate support is near the $180 level, followed by the $174 swing low. A break below the $174 swing low may perhaps push the price towards $162.
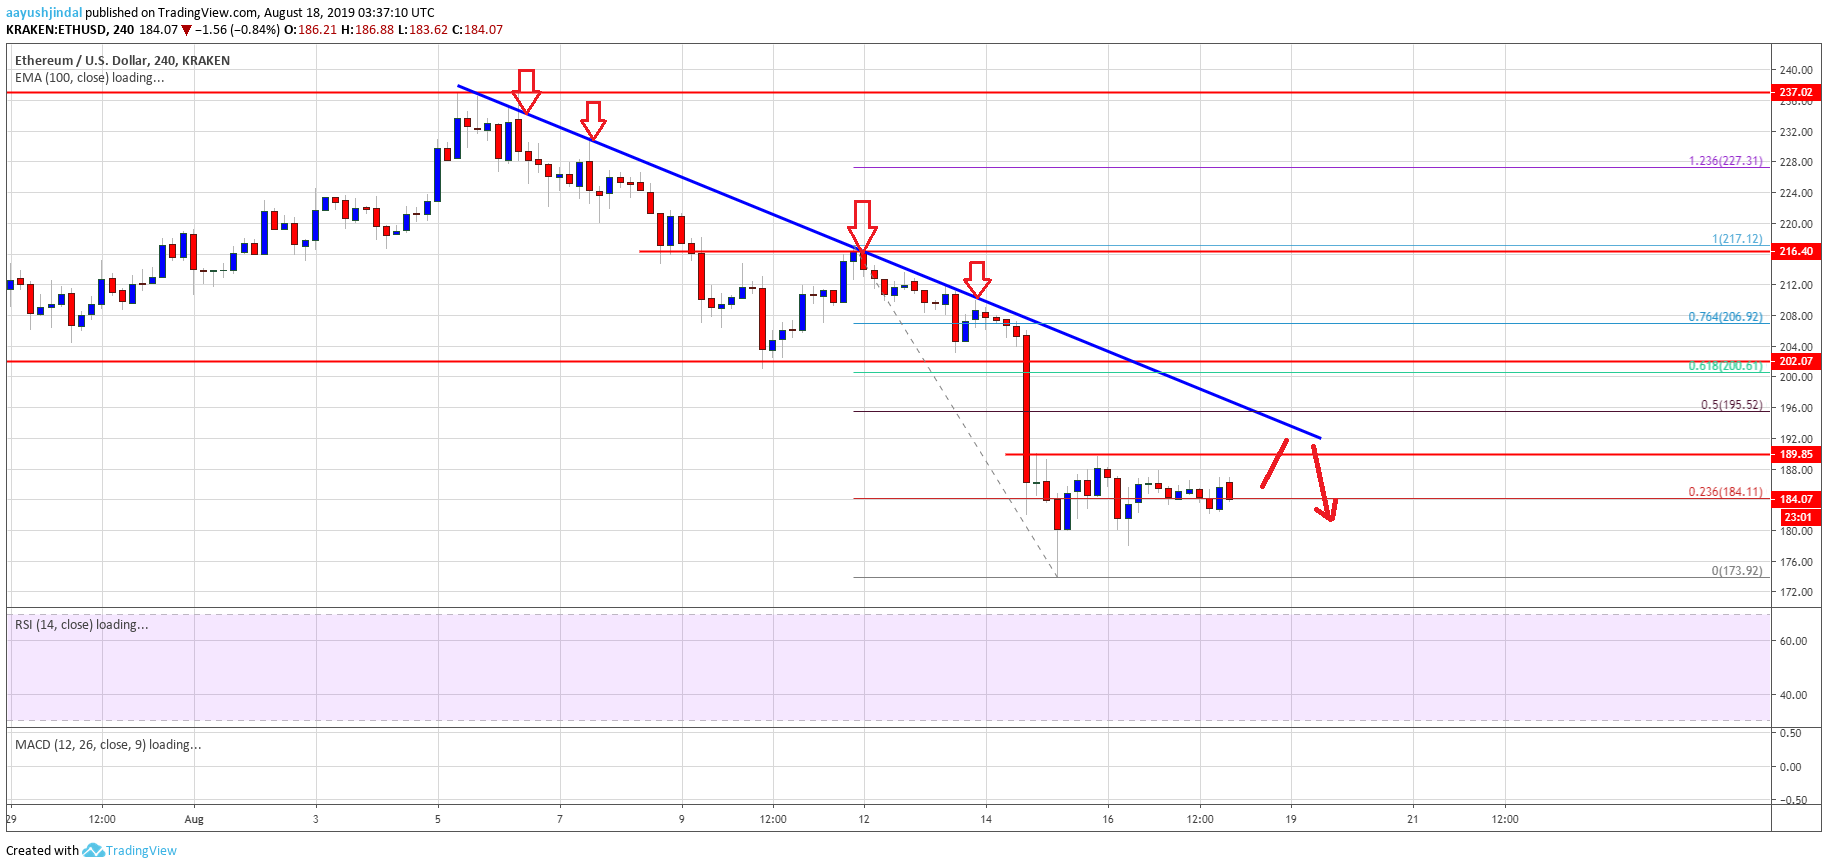
The above chart indicates that Ethereum price is currently consolidating below key resistances such as $192, $195 and $200. To start a strong recovery and upward move, the price must settle above $200 in the coming days.
Technical Indicators
4 hours MACD – The MACD for ETH/USD is currently placed in the bullish zone, with neutral signs.
4 hours RSI – The RSI for ETH/USD is currently near the 40 level, with a few positive signs.
Major Support Level – $174
Major Resistance Level – $200