
Reason to trust
How Our News is Made
Strict editorial policy that focuses on accuracy, relevance, and impartiality
Ad discliamer
Morbi pretium leo et nisl aliquam mollis. Quisque arcu lorem, ultricies quis pellentesque nec, ullamcorper eu odio.
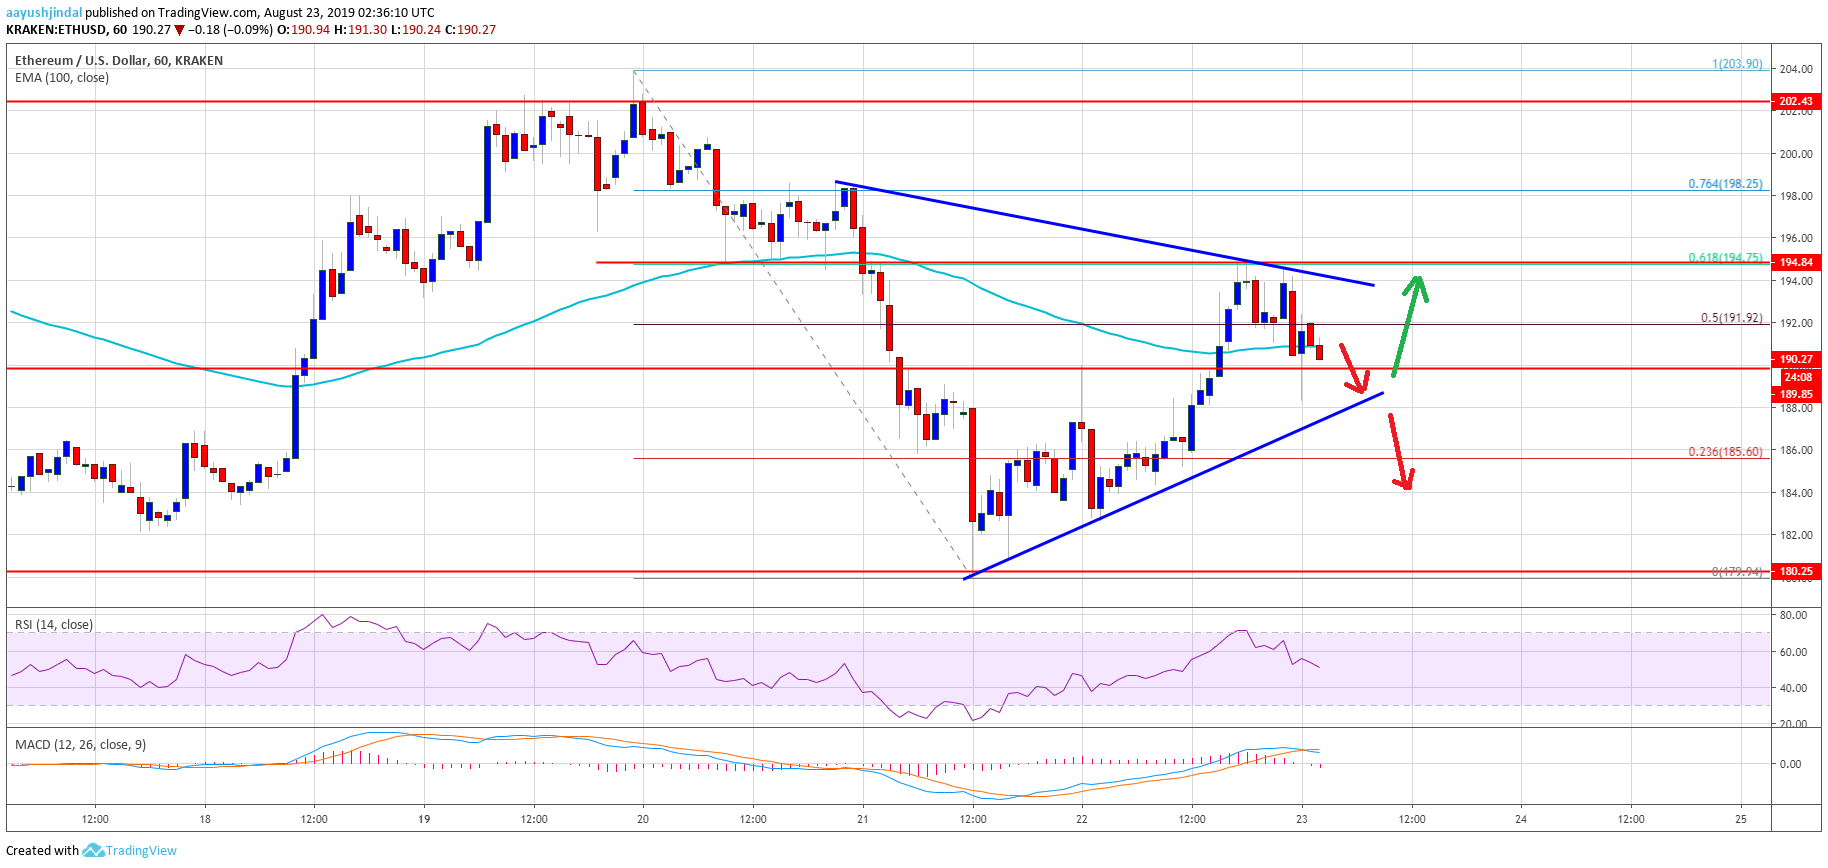
- ETH price started a decent recovery after it tested the $180 support area against the US Dollar.
- The price is currently struggling to break a major resistance area near the $195 level.
- There is a key contracting triangle forming with resistance near $194 on the hourly chart of ETH/USD (data feed via Kraken).
- The pair remains at a risk of a fresh decline until it breaks the $194 and $195 resistance levels.
Ethereum price is facing a couple of important resistances versus the US Dollar and bitcoin. ETH could start another bearish wave if its breaks the $186 support level.
Ethereum Price Analysis
Recently, ETH price declined sharply below the $195 and $190 support levels against the US Dollar. Moreover, the price traded below the $184 support and tested the $180 support. Finally, the bulls managed to protect further losses and the price recently started an upside correction above the $185 level. There was a break above the 50% Fib retracement level of the last key decline from the $204 swing high to $180 low.
Additionally, Ethereum managed to climb above the $190 resistance and 100 hourly simple moving average. However, the previous major support near $195 acted as a strong resistance and prevented further upsides. It seems like the 61.8% Fib retracement level of the last key decline from the $204 swing high to $180 low also acted as a major resistance for the bulls.
At the moment, the price is correcting lower towards the $190 support. More importantly, there is a key contracting triangle forming with resistance near $194 on the hourly chart of ETH/USD. Therefore, the price seems to be preparing for the next break either above the $195 resistance or below the $188 level. On the upside, a clear break above the $195 resistance could push Ether higher in the coming sessions towards $200.
Conversely, if there is a downside break below the $188 and $185 supports, the price is likely to resume its decline. The next major support is near the $180 level. If there are additional losses, the price is likely to aim the $170 support area in the near term.
Looking at the chart, Ethereum price is clearly trading near a major resistance at $195. It could climb above $195 and rise sharply towards the $200 and $202 resistance levels. On the other hand, the bulls might continue to struggle and there might be another drop towards the $180 level or lower.
ETH Technical Indicators
Hourly MACD – The MACD for ETH/USD is slowly gaining pace in the bearish zone.
Hourly RSI – The RSI for ETH/USD is currently sliding towards the 50 level.
Major Support Level – $185
Major Resistance Level – $195


