
Reason to trust
How Our News is Made
Strict editorial policy that focuses on accuracy, relevance, and impartiality
Ad discliamer
Morbi pretium leo et nisl aliquam mollis. Quisque arcu lorem, ultricies quis pellentesque nec, ullamcorper eu odio.
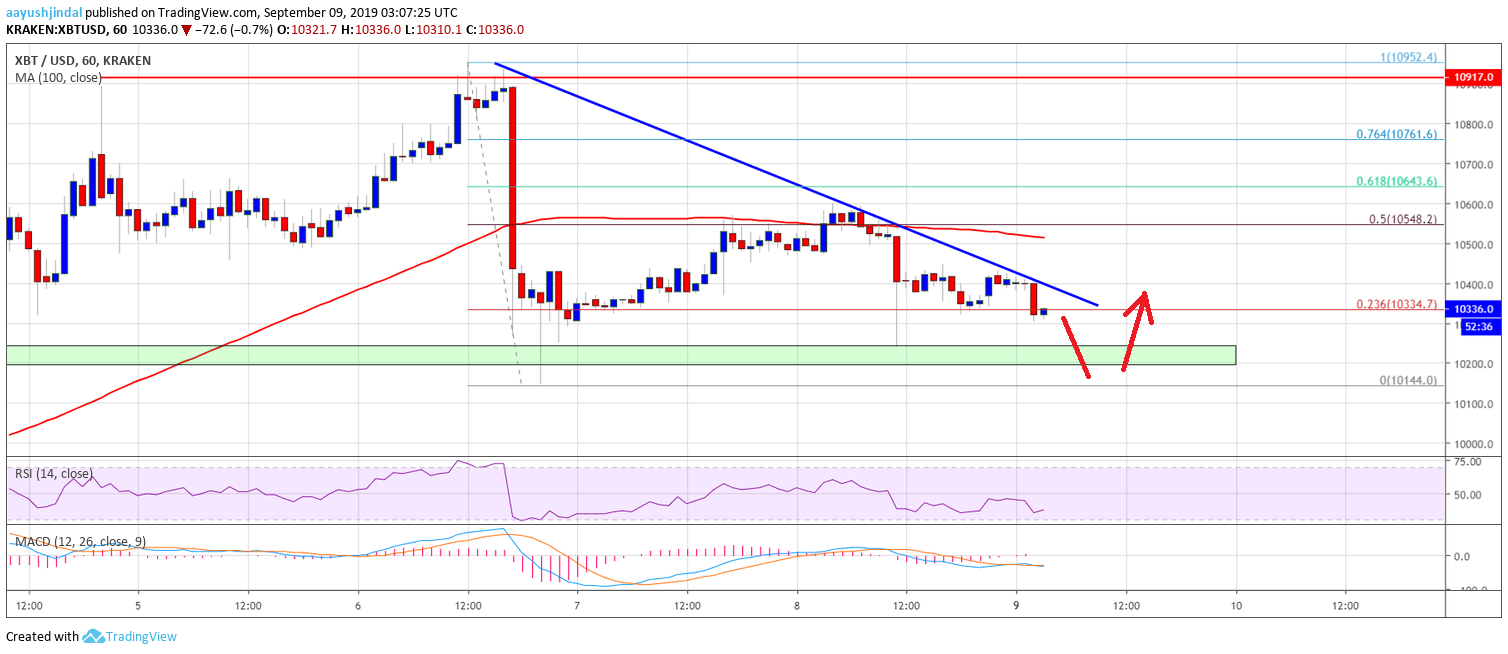
- Bitcoin price is under pressure and it recently declined below the $10,500 support against the US Dollar.
- The price is struggling to climb higher and is approaching the $10,200 support area.
- There is a key bearish trend line forming with resistance near $10,400 on the hourly chart of the BTC/USD pair (data feed from Kraken).
- The price could accelerate decline if it breaks the $10,200 and $10,100 support levels in the near term.
Bitcoin price is showing a few negative signs below $10,500 against the US Dollar. BTC could struggle to recover above the $10,400 and $10,500 resistance levels.
Bitcoin Price Analysis
Recently, bitcoin price struggled to surpass the $11,000 resistance area against the US Dollar. As a result, there was a downside correction and BTC/USD traded below the $10,600 and $10,500 support levels. Moreover, there was a close below the $10,500 support level and the 100 hourly simple moving average. It opened the doors for more losses below the $10,400 level.
The price traded as low as $10,144 and recently started an upside correction. There was a break above the $10,300 level plus the 23.6% Fib retracement level of the last major decline from the $10,952 high to $10,144 low. Additionally, the price spiked above the $10,500 resistance. However, it failed to continue higher. It also struggled to clear the 50% Fib retracement level of the last major decline from the $10,952 high to $10,144 low.
More importantly, there is a key bearish trend line forming with resistance near $10,400 on the hourly chart of the BTC/USD pair. The pair is currently trading well below the $10,400 level. An immediate support area is near the $10,200 level. If there is a downside break below the $10,200 support area, there could be a bearish acceleration towards the $10,000 support area.
On the upside, the main resistances are near the $10,400 and $10,500 levels. If there is a successful close above $10,500, the price could continue to rise in the coming sessions. The next key resistance is near the $10,650 level. It coincides with the 61.8% Fib retracement level of the last major decline from the $10,952 high to $10,144 low.
Looking at the chart, bitcoin price is clearly struggling to continue higher and is trading with a bearish angle below the $10,400 level. If the price continues to decline and breaks the $10,200 support area, there is a risk of more losses below the $10,000 level.
Technical indicators:
Hourly MACD – The MACD is currently moving in the bearish zone.
Hourly RSI (Relative Strength Index) – The RSI for BTC/USD is now well below the 50 level.
Major Support Levels – $10,200 followed by $10,100.
Major Resistance Levels – $10,400, $10,550 and $10,650.


