

- Bitcoin price is moving lower and is trading well below the $10,250 resistance against the US Dollar.
- The price is likely to extend its decline below the $10,000 support level in the coming sessions.
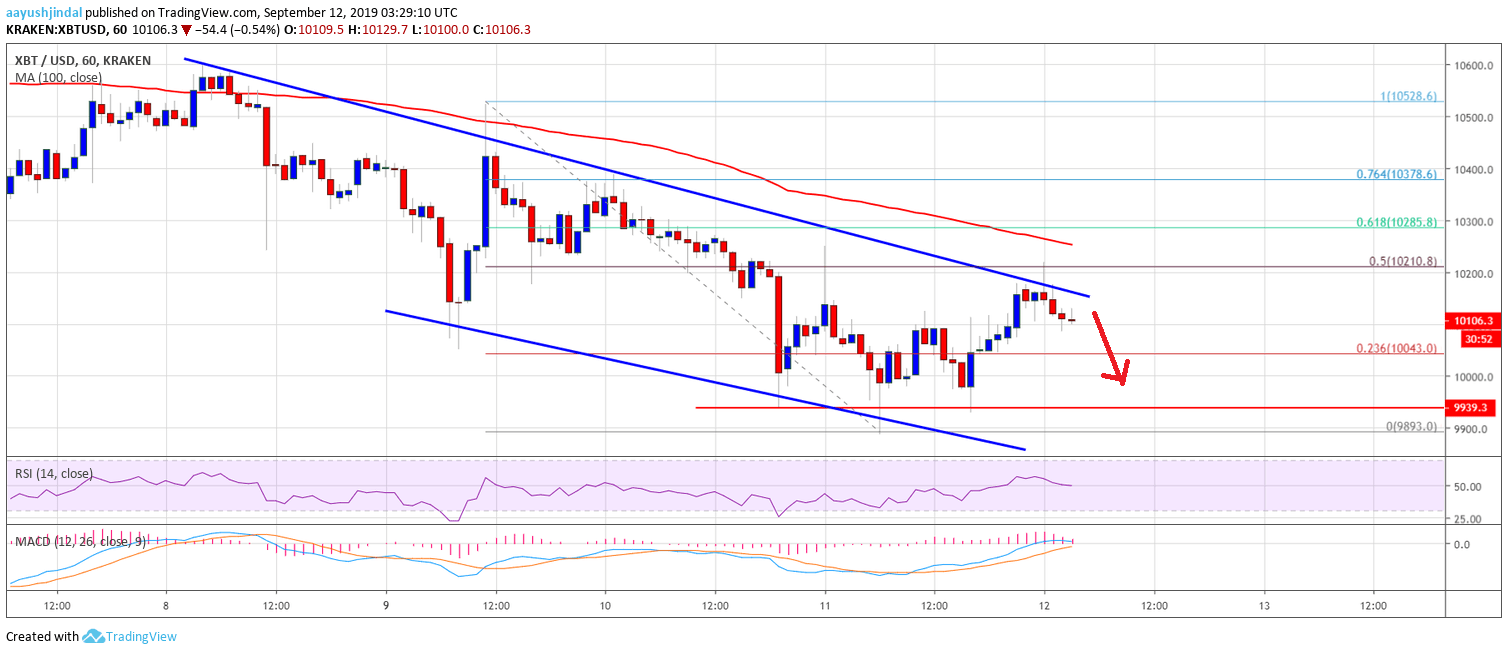
- There is a major declining channel forming with resistance near $10,180 on the hourly chart of the BTC/USD pair (data feed from Kraken).
- The price remains at a risk of more downside as long as the price is below $10,250 and $10,400.
Bitcoin price is showing a lot of bearish signs below $10,400 against the US Dollar. BTC could accelerate losses if there is a daily close below the $10,000 support.
Bitcoin Price Analysis
This week, we discussed downtrend for bitcoin price below the $10,500 pivot level against the US Dollar. The price settled below $10,400 and the 100 hourly simple moving average. Moreover, the price declined below the $10,250 support area to move into a negative zone. The recent decline was such that the price spiked below the $10,000 level. Besides, there were spikes below $9,900 and a new weekly swing low at $9,893.
Recently, there was an upside correction above $10,040 plus the 23.6% Fib retracement level of the downward move from the $10,58 high to $9,893 low. However, the price is facing hurdles near the $10,200 level. It seems like the 50% Fib retracement level of the downward move from the $10,58 high to $9,893 low is capping the upward move.
Additionally, there is a major declining channel forming with resistance near $10,180 on the hourly chart of the BTC/USD pair. Above the channel resistance, the 100 hourly SMA is positioned near the $10,250 level. Therefore, the price needs to climb above the $10,200 and $10,250 resistance levels to start a decent recovery. The 61.8% Fib retracement level of the downward move from the $10,58 high to $9,893 low is also near $10,280.
If there is no upside break, the price could continue to move down towards $10,000 and $9,900. A downside break below the $9,893 swing low could push the price towards the $9,800 support area. Any further losses could open the doors for a push towards the $9,500 level.
Looking at the chart, bitcoin price is showing bearish signs below the $10,200 and $10,250 levels. Therefore, there are high chances of a bearish break below the $10,000 and $9,800 level in the near term. The main target for the bears this week could be $9,650 or $9,500.
Technical indicators:
Hourly MACD – The MACD is about to move back in the bearish zone.
Hourly RSI (Relative Strength Index) – The RSI for BTC/USD is about to break the 50 level.
Major Support Levels – $10,000 followed by $9,900.
Major Resistance Levels – $10,200, $10,250 and $10,350.