
Reason to trust
How Our News is Made
Strict editorial policy that focuses on accuracy, relevance, and impartiality
Ad discliamer
Morbi pretium leo et nisl aliquam mollis. Quisque arcu lorem, ultricies quis pellentesque nec, ullamcorper eu odio.
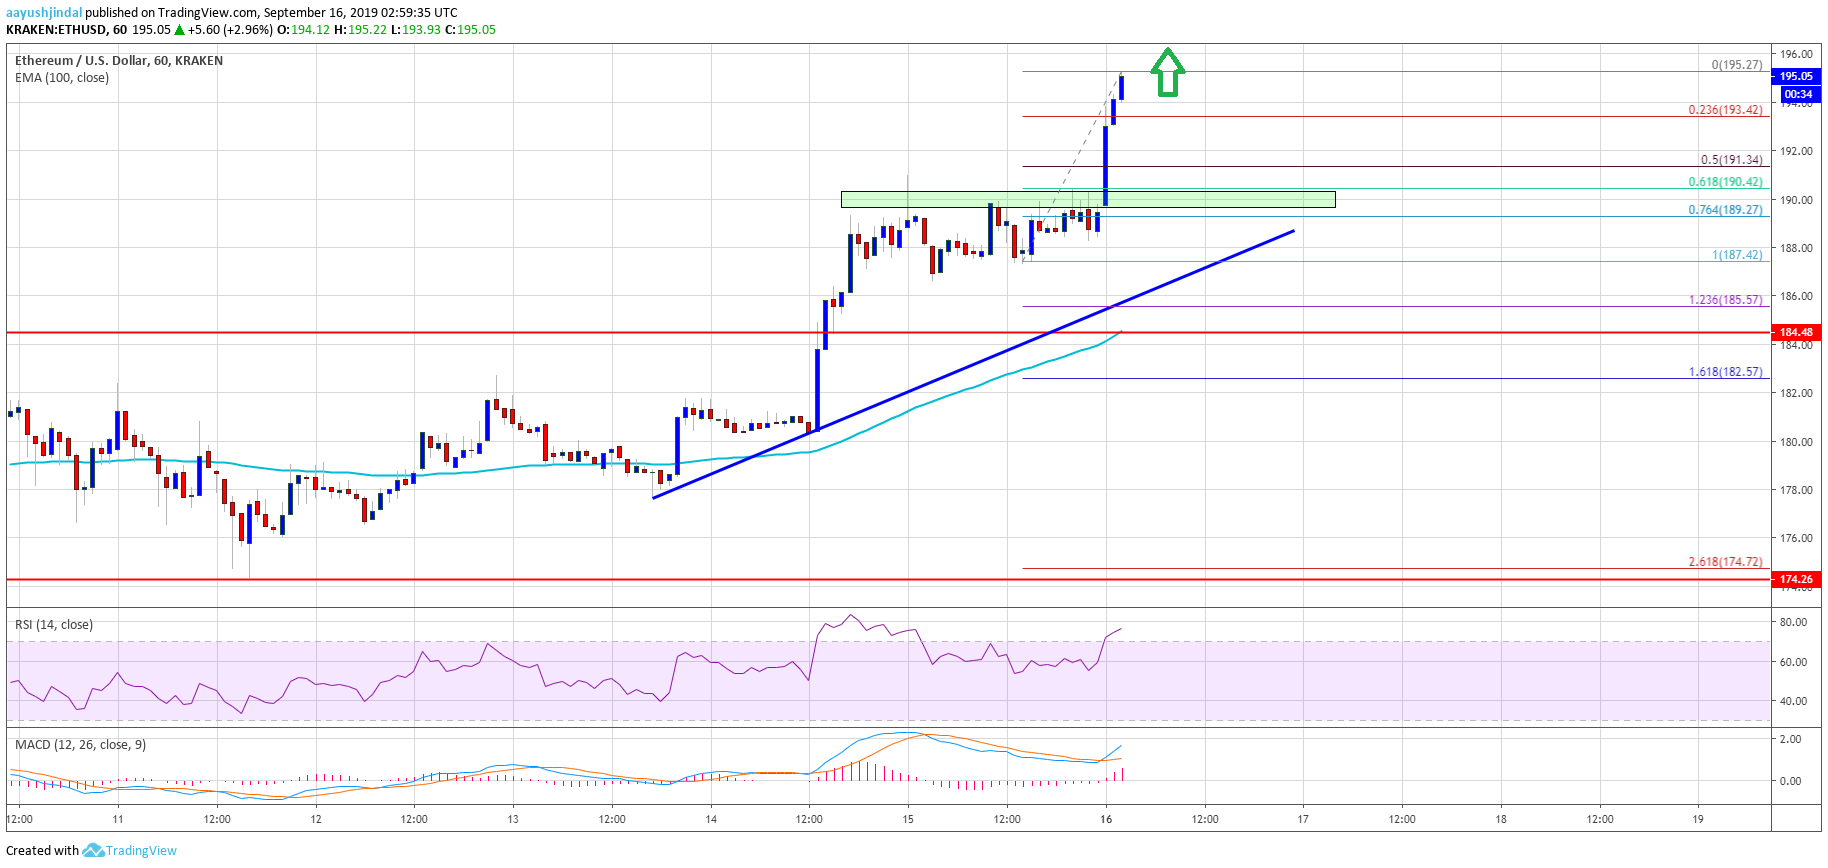
- ETH price broke the main $185 resistance and climbed above $190 against the US Dollar.
- Bitcoin price is consolidating above the $10,300 support area, with positive signs.
- There is a connecting bullish trend line forming with support near $188 on the hourly chart of ETH/USD (data feed via Kraken).
- The pair is likely to continue higher and it might soon test the $200 resistance area in the near term.
Ethereum price is climbing above $190 versus the US Dollar and recovering vs bitcoin. ETH price is showing positive signs and it might continue to rise towards $200-$205.
Ethereum Price Analysis
In the past analysis, we discussed the chances of an upside break in ETH price above the $185 resistance against the US Dollar. The price did gain traction and broke the main $185 and $186 resistance levels. Moreover, there was a close above $185 and the 100 hourly simple moving average. It opened the doors for more gains above the $190 level. On the other hand, bitcoin price remained in a range above the $10,300 level.
Ethereum price even broke the $192 level and traded to a new weekly high at $195. The current price action indicates more gains above the $195 level. If there is a downside correction, an initial support is near the $193 level. It coincides with the 23.6% Fib retracement level of the recent upward move from the $187 swing low to $195 high.
However, the main support on the downside is near the $190 level. It represents the 50% Fib retracement level of the recent upward move from the $187 swing low to $195 high. Additionally, there is a connecting bullish trend line forming with support near $188 on the hourly chart of ETH/USD. Therefore, if there is a downside correction, the price is likely to find buyers near $190 or $188.
On the upside, a convincing break above the $195 level could open the doors for a push towards the $200 resistance level. However, the main resistance is near the $205 level (the previous support), above which the price could surge towards $220.
Looking at the chart, Ethereum price is trading with a strong bullish bias above the $190 level. If the price remains above the $190 level for a couple of sessions, there are high chances of a run towards the $200 and $205 levels. If not, the price may perhaps extend the correction towards $188 or $185.
ETH Technical Indicators
Hourly MACD – The MACD for ETH/USD is currently gaining momentum in the bullish zone.
Hourly RSI – The RSI for ETH/USD is currently climbing higher and it is well above the 70 level.
Major Support Level – $190
Major Resistance Level – $195


