

- Ripple price is still struggling to surpass the main $0.2650 resistance area against the US dollar.
- The price is showing a few positive signs, but it must break the $0.2650 resistance level.
- There is a major breakout pattern forming with support near $0.2585 on the hourly chart of the XRP/USD pair (data source from Kraken).
- The price could either rally above $0.2650 or it might resume its decline below the $0.2580 level.
Ripple price is trading well below the $0.2650 resistance against the US Dollar, and ranging vs bitcoin. XRP price could soon make the next move either above $0.2650 or towards $0.2500.
Ripple Price Analysis
In the past 2-3 weeks, XRP price made many attempts to surpass the $0.2650 resistance area against the US Dollar. However, the bulls failed to gain momentum above $0.2640 and $0.2650. On the other hand, Ethereum was able to break the $185 resistance area to start an upward move. Therefore, ripple bulls need to gain pace above $0.2650 to start a solid upward move in the coming days.
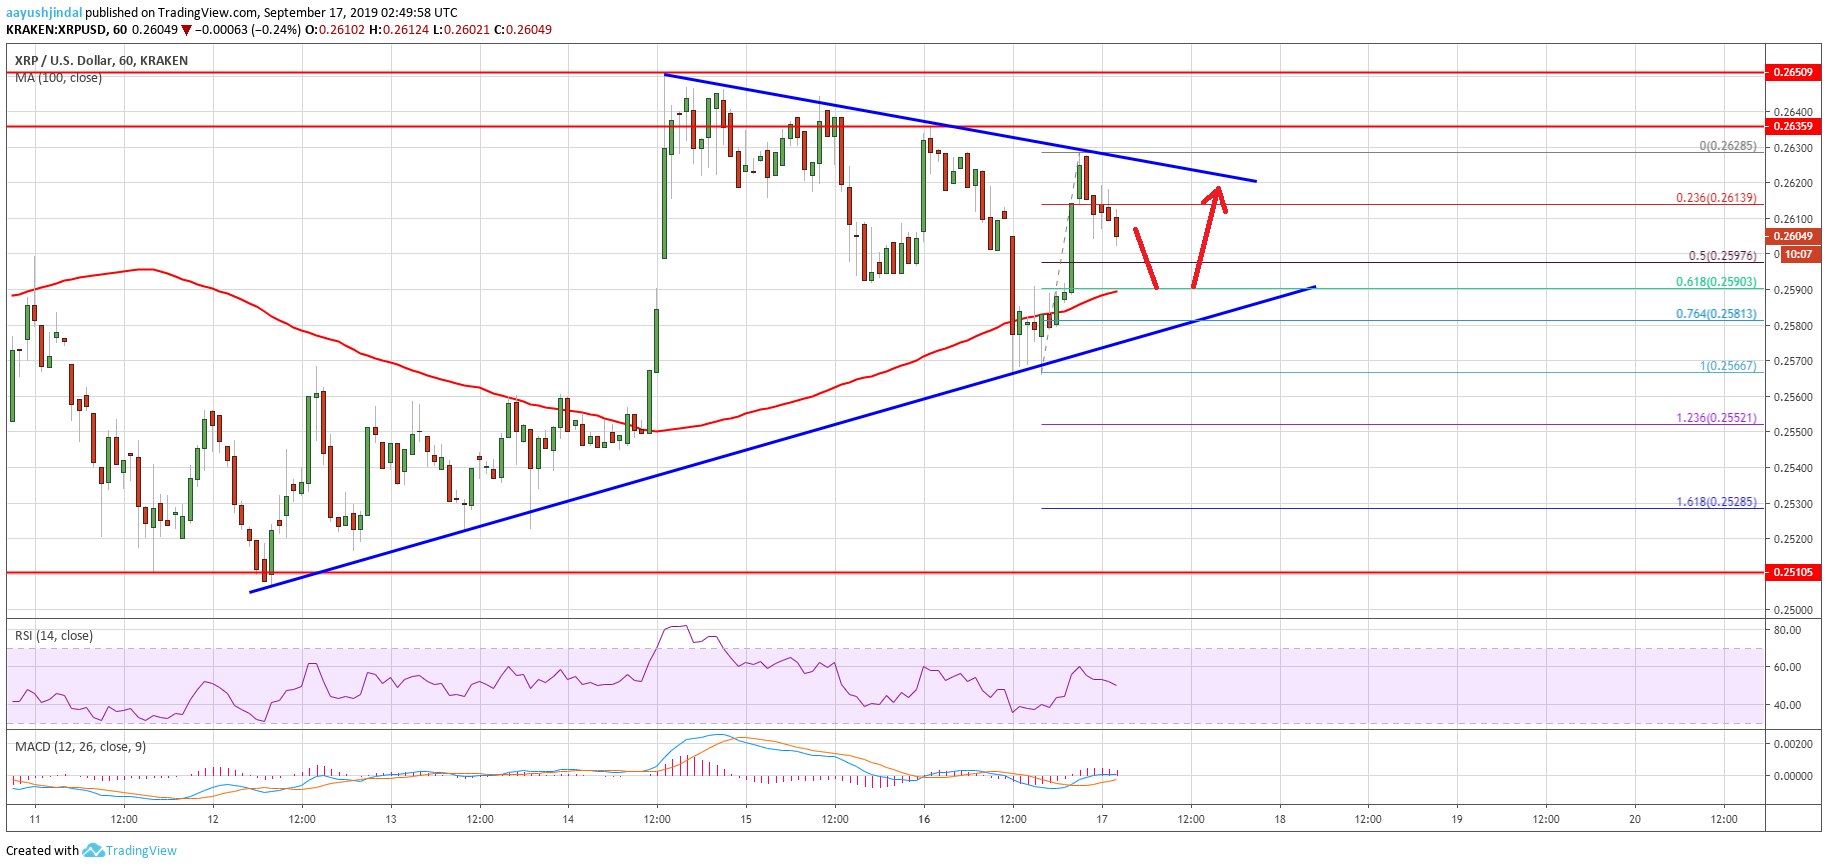
The last swing low was formed near $0.2566 and the recent high was near $0.2628. At the moment, the price is correcting lower below $0.2610 and trading well above the 100 hourly simple moving average. An immediate support is near the $0.2600 level. It coincides with the 50% Fib retracement level of the recent wave from the $0.2566 low to $0.2628 high.
The main support on the downside is near the $0.2590 level and the 100 hourly simple moving average. Additionally, the 61.8% Fib retracement level of the recent wave from the $0.2566 low to $0.2628 high is near $0.2590. More importantly, there is a major breakout pattern forming with support near $0.2585 on the hourly chart of the XRP/USD pair.
Therefore, ripple price seems to be preparing for the next major break either above $0.2650 or towards $0.2500. This time, the chances of an upside break above $0.2650 are high. If the bulls gain control above $0.2650, the price could climb higher significantly towards $0.2850 or even $0.3000 in the near term. Conversely, if it fails again near $0.2650, there could be a fresh decline towards the $0.2500 support.
Looking at the chart, ripple price is confined in a broad range below the $0.2650 resistance. There could be more ranging moves, but sooner or later, the price is likely to break the $0.2650 resistance area.
Technical Indicators
Hourly MACD – The MACD for XRP/USD is currently placed nicely in the bullish zone.
Hourly RSI (Relative Strength Index) – The RSI for XRP/USD is correcting lower towards the 50 level.
Major Support Levels – $0.2600, $0.2580 and $0.2550.
Major Resistance Levels – $0.2640, $0.2650 and $0.2720.