
Reason to trust
How Our News is Made
Strict editorial policy that focuses on accuracy, relevance, and impartiality
Ad discliamer
Morbi pretium leo et nisl aliquam mollis. Quisque arcu lorem, ultricies quis pellentesque nec, ullamcorper eu odio.
- ETH price rallied further and broke the $200 and $210 resistance levels against the US Dollar.
- Bitcoin price is consolidating near the $10,200 and $10,250 pivot levels.
- There is a new connecting bullish trend line forming with support near $206 on the hourly chart of ETH/USD (data feed via Kraken).
- The pair is showing a lot of bullish signs and it might even surpass the $215 resistance level.
Ethereum price is up close to 8% and ripple surged 18% versus the US Dollar, while bitcoin is consolidating. ETH price could continue to grind higher towards $225.
Ethereum Price Analysis
Yesterday, there was a sharp rise in ETH price above the $195 resistance against the US Dollar. Later, the price even touched the $200 level before starting a consolidation phase. Finally, the price broke to the upside and surpassed the $200 barrier. It opened the doors for more gains above the $205 and $210 resistance levels. A new weekly high was formed near $215 before the price started a downside correction.
Besides, ripple price performed really well and surged more than 15%. XRP broke the $0.2650 resistance (as discussed yesterday), opening the doors for a massive upward move. Looking at Ethereum, the price corrected gains recently after setting a new monthly high near $215. The price declined below the $210 level. Moreover, there was a break below the 23.6% Fib retracement level of the recent wave from the $196 low to $215 high.
However, the $208 level acted as a support and prevented additional losses. On the downside, there are many supports near $208 and $206. There is also a new connecting bullish trend line forming with support near $206 on the hourly chart of ETH/USD. The 50% Fib retracement level of the recent wave from the $196 low to $215 high is also sitting tight near the $206 level.
Therefore, the price remains well supported near $208 and $206. Below the $206 support, the price could test the $200 support area. On the upside, an immediate resistance is near the $215 level. If there is an upside break above $215, the price could continue to rise towards the $220 and $225 levels.
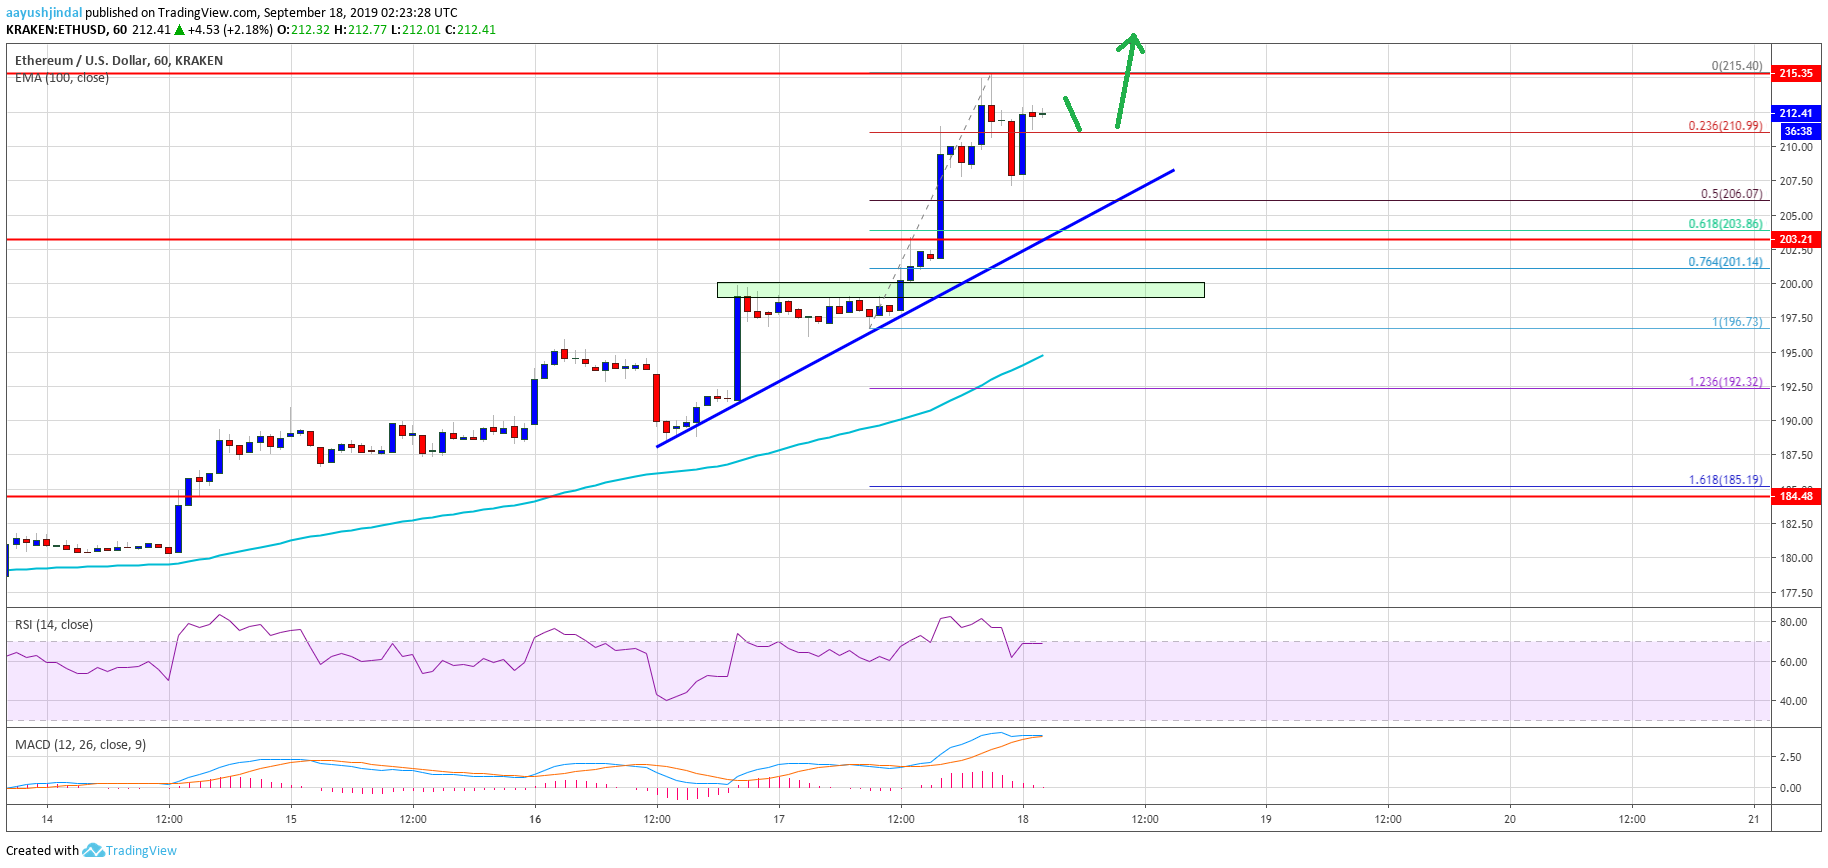
Looking at the chart, Ethereum price is showing a lot of bullish signs and it might even surpass the $215 resistance level. The next targets for the bulls may perhaps be near the $225 level. On the downside, the main supports are near $208 and $206.
ETH Technical Indicators
Hourly MACD – The MACD for ETH/USD is still showing positive signs in the bullish zone.
Hourly RSI – The RSI for ETH/USD is currently well above the 60 level.
Major Support Level – $206
Major Resistance Level – $215


