

- Bitcoin price started a strong rise after trading as low as $9,637 against the US Dollar.
- The price is trading above the $10,200 level, but it is facing hurdles near the $10,400 level.
- There was a break above a major bearish trend line with resistance near $10,150 on the hourly chart of the BTC/USD pair (data feed from Kraken).
- The price is currently correcting lower towards the $10,150 and $10,100 support levels.
Bitcoin price is showing positive signs above the $10,100 level against the US Dollar. BTC needs to surpass the $10,400 resistance area to continue higher in the near term.
Bitcoin Price Analysis
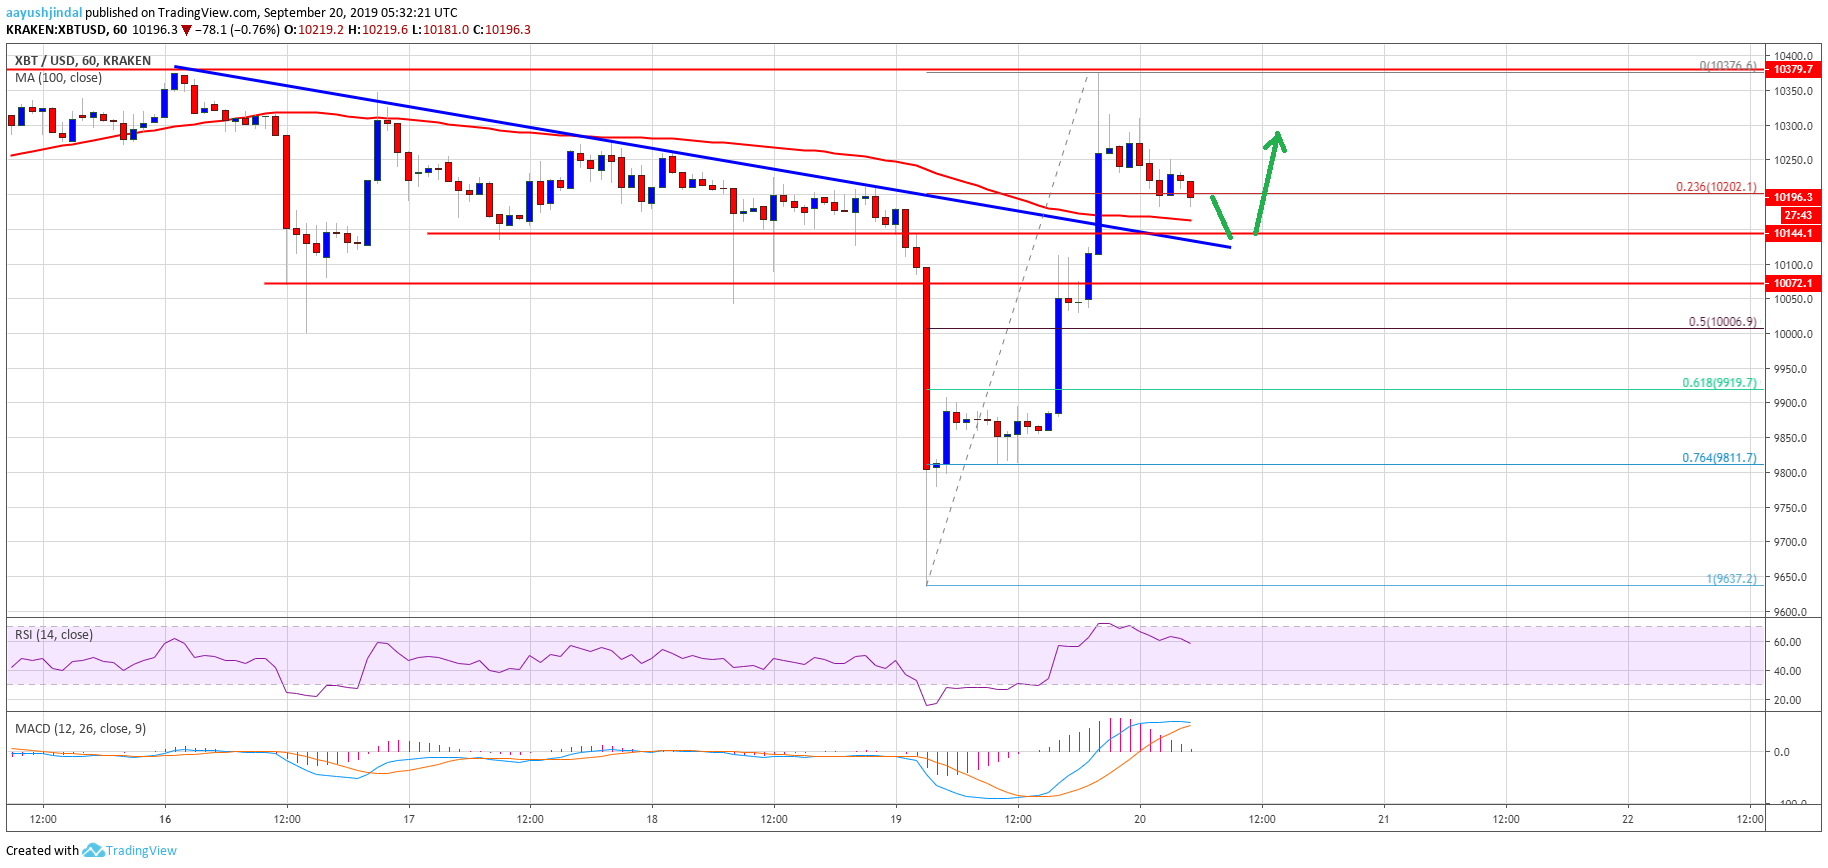
Yesterday, there was a sharp decline in bitcoin below the $10,000 support against the US Dollar. Moreover, BTC price traded below the $9,800 support level. A new weekly low was formed at $9,637 and recently the price started a strong recovery. There was a break above the $10,000 resistance area and a close above the 100 hourly simple moving average.
It opened the doors for more gains above the $10,100 and $10,200 levels. Moreover, there was a break above a major bearish trend line with resistance near $10,150 on the hourly chart of the BTC/USD pair. The pair traded towards the $10,400 resistance area, where sellers emerged. A high was formed near $10,376 and the price is currently correcting lower. It broke the 23.6% Fib retracement level of the recent rally from the $9,637 low to $10,376 high.
On the downside, there are many supports near the $10,150 level and the 100 hourly simple moving average. The broken trend line might also provide support near $10,150. If there are more downsides, the price could test the $10,000 support area. It now coincides with the 50% Fib retracement level of the recent rally from the $9,637 low to $10,376 high.
On the upside, an immediate resistance is near the $10,300 level. However, the main resistance is near the $10,400 level. If there is an upside break above $10,400, the price could continue to rise towards the $10,500 and $10,800 levels.
Looking at the chart, bitcoin price is back in a positive zone above the $10,000 support area. In the short term, there could be range moves above the $10,000 level before the next move. If the bulls remain in action, they could soon make another attempt to push the price above the main $10,400 resistance area.
Technical indicators:
Hourly MACD – The MACD is slowly moving into the bearish zone.
Hourly RSI (Relative Strength Index) – The RSI for BTC/USD is currently correcting lower towards the 50 level.
Major Support Levels – $10,150 followed by $10,000.
Major Resistance Levels – $10,300, $10,375 and $10,400.