
Reason to trust
How Our News is Made
Strict editorial policy that focuses on accuracy, relevance, and impartiality
Ad discliamer
Morbi pretium leo et nisl aliquam mollis. Quisque arcu lorem, ultricies quis pellentesque nec, ullamcorper eu odio.
- Bitcoin price is down more than 12% and it recently broke the $8,500 support against the US Dollar.
- The price is currently correcting higher, but the $8,750 and $8,800 levels are preventing recovery.
- There is a crucial bearish trend line forming with resistance near $9,500 on the hourly chart of the BTC/USD pair (data feed from Kraken).
- The price is likely to resume its decline as long as it is below $8,750 and $9,000.
Bitcoin price nosedived below $9,000 and tested $8,050 against the US Dollar. BTC remains at a risk of more downsides as long as it is below $9,000.
Bitcoin Price Analysis
Yesterday, we saw a breakdown in bitcoin below the $10,000 support area against the US Dollar. The price remained in a bearish zone and broke many supports near $9,800 and $9,500. Moreover, there was a break below the $9,000 support and the 100 hourly simple moving average. Finally, the price traded close to the $8,000 level and registered a nasty decline. A low was formed near $8,055 and the price is currently correcting higher.
There was a break above the $8,250 and $8,400 levels. Moreover, the price traded above the 23.6% Fib retracement level of the recent decline from the $9,779 high to $8,055 low. However, the $8,750 level is acting as a strong resistance. The next resistance is near the $8,920 level. It coincides with the 50% Fib retracement level of the recent decline from the $9,779 high to $8,055 low.
If there is an upside break above $9,000, the price could recover towards the $9,400 and $9,500 resistance levels. Additionally, there is a crucial bearish trend line forming with resistance near $9,500 on the hourly chart of the BTC/USD pair. An intermediate resistance is near $9,120 and the 61.8% Fib retracement level of the recent decline from the $9,779 high to $8,055 low.
On the other hand, if the price continues to struggle near $8,750 and $9,000, it could resume its decline. An immediate support is near the $8,400 level, below which it could test $8,250. If the bears remain in action, there is a chances of a break below $8,000. The next major support is near the $7,500 level.
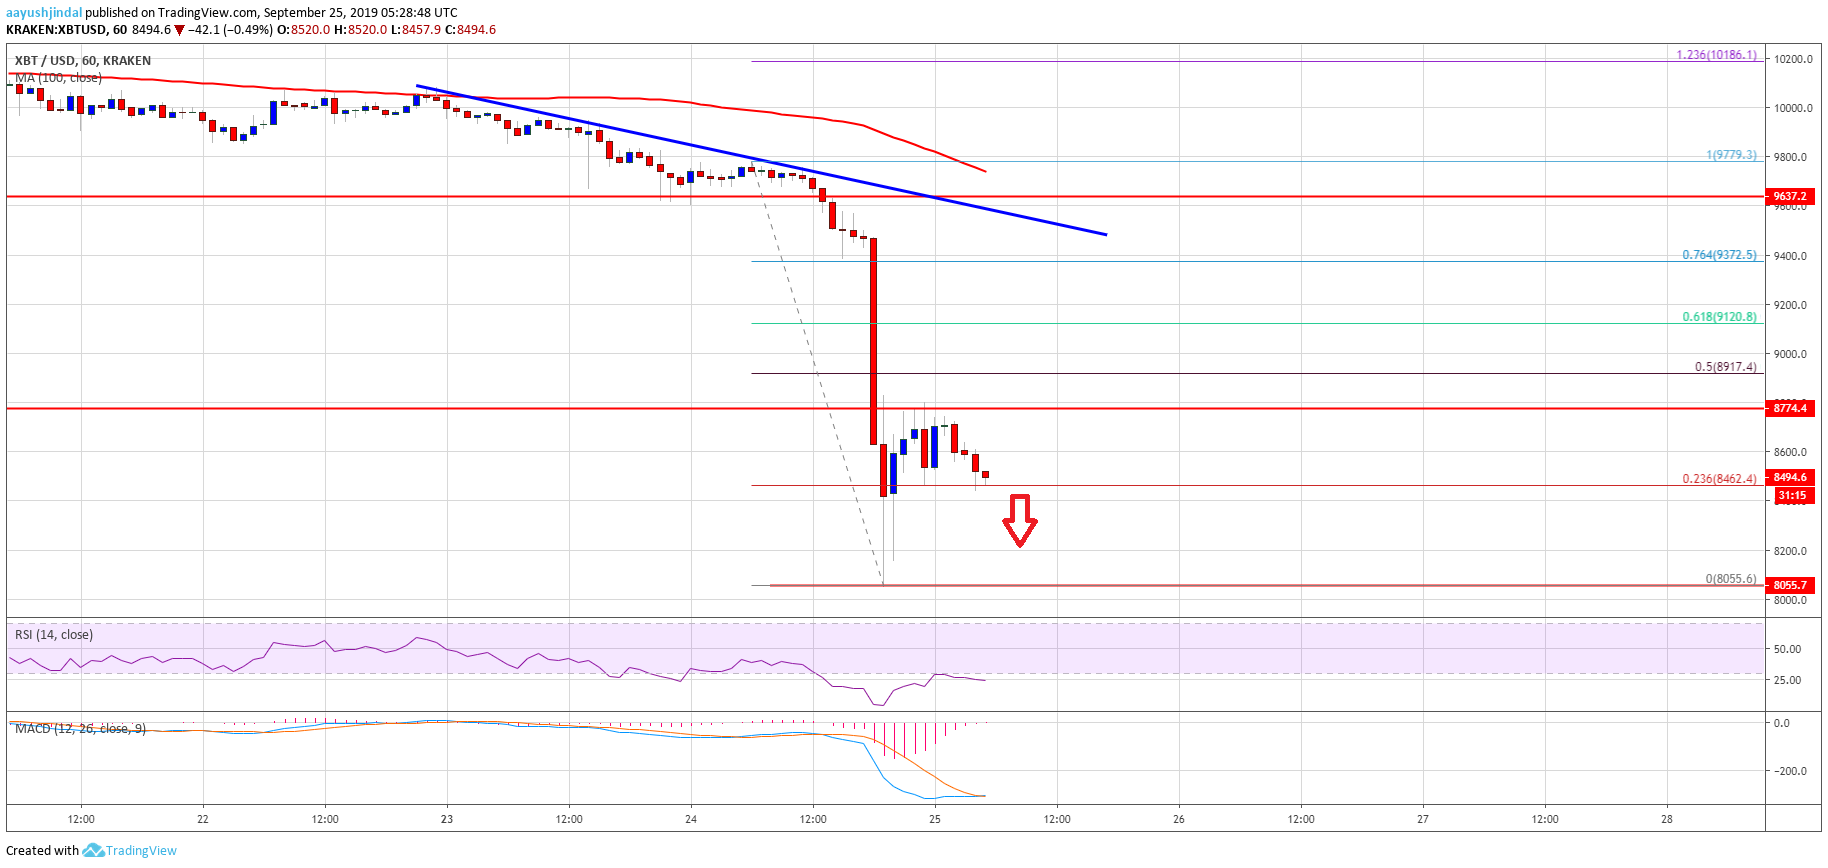
Looking at the chart, bitcoin price is clearly bleeding below $9,000 and it might continue to decline. It seems like there are high chances of a break below $8,000 in the near term.
Technical indicators:
Hourly MACD – The MACD is showing a few positive signs in the bearish zone.
Hourly RSI (Relative Strength Index) – The RSI for BTC/USD is currently struggling to recover above the 30 level.
Major Support Levels – $8,250 followed by $8,000.
Major Resistance Levels – $8,750, $8,800 and $9,120.


