
Reason to trust
How Our News is Made
Strict editorial policy that focuses on accuracy, relevance, and impartiality
Ad discliamer
Morbi pretium leo et nisl aliquam mollis. Quisque arcu lorem, ultricies quis pellentesque nec, ullamcorper eu odio.
- Bitcoin price is currently declining after it failed to surpass the $8,400 resistance against the US Dollar.
- The price is trading near the $8,000 support level, with a minor bearish angle.
- There is a key declining channel forming with resistance near the $8,260 level on the hourly chart of the BTC/USD pair (data feed from Kraken).
- The price is at a risk of a downside break below the $8,000 support in the near term.
Bitcoin price is struggling to hold the key $8,000 support against the US Dollar. BTC might dip towards the $7,800 support area before it could start a decent recovery.
Bitcoin Price Analysis
In the past two sessions, there were bearish moves in bitcoin below $8,300 against the US Dollar. The BTC/USD pair followed a bearish path and broke the $8,200 support area. Moreover, there was a close below the $8,200 level and the 100 hourly simple moving average. The last swing high was formed near $8,300 before the price broke $8,200 support.
Additionally, there was a break below the 50% Fib retracement level of the upward move from the $7,659 low to $8,539 high. The recent decline was such that the price tested the $8,000 support area. More importantly, the price tested the 61.8% Fib retracement level of the upward move from the $7,659 low to $8,539 high. At the moment, the price is struggling to hold the $8,000 support area.
It seems like there is a key declining channel forming with resistance near the $8,260 level on the hourly chart of the BTC/USD pair. Thus, if there is a downside break below the $8,000 support, the price could accelerate its decline towards the $7,800 support area. Besides, an intermediate support is near $7,850 or the 76.4% Fib retracement level of the upward move from the $7,659 low to $8,539 high.
On the upside, there is a solid resistance forming near the $8,250 level and the 100 hourly SMA. Therefore, if there is an upside break above $8,250 and $8,300, the price could trade towards the main $8,500 resistance level in the near term.
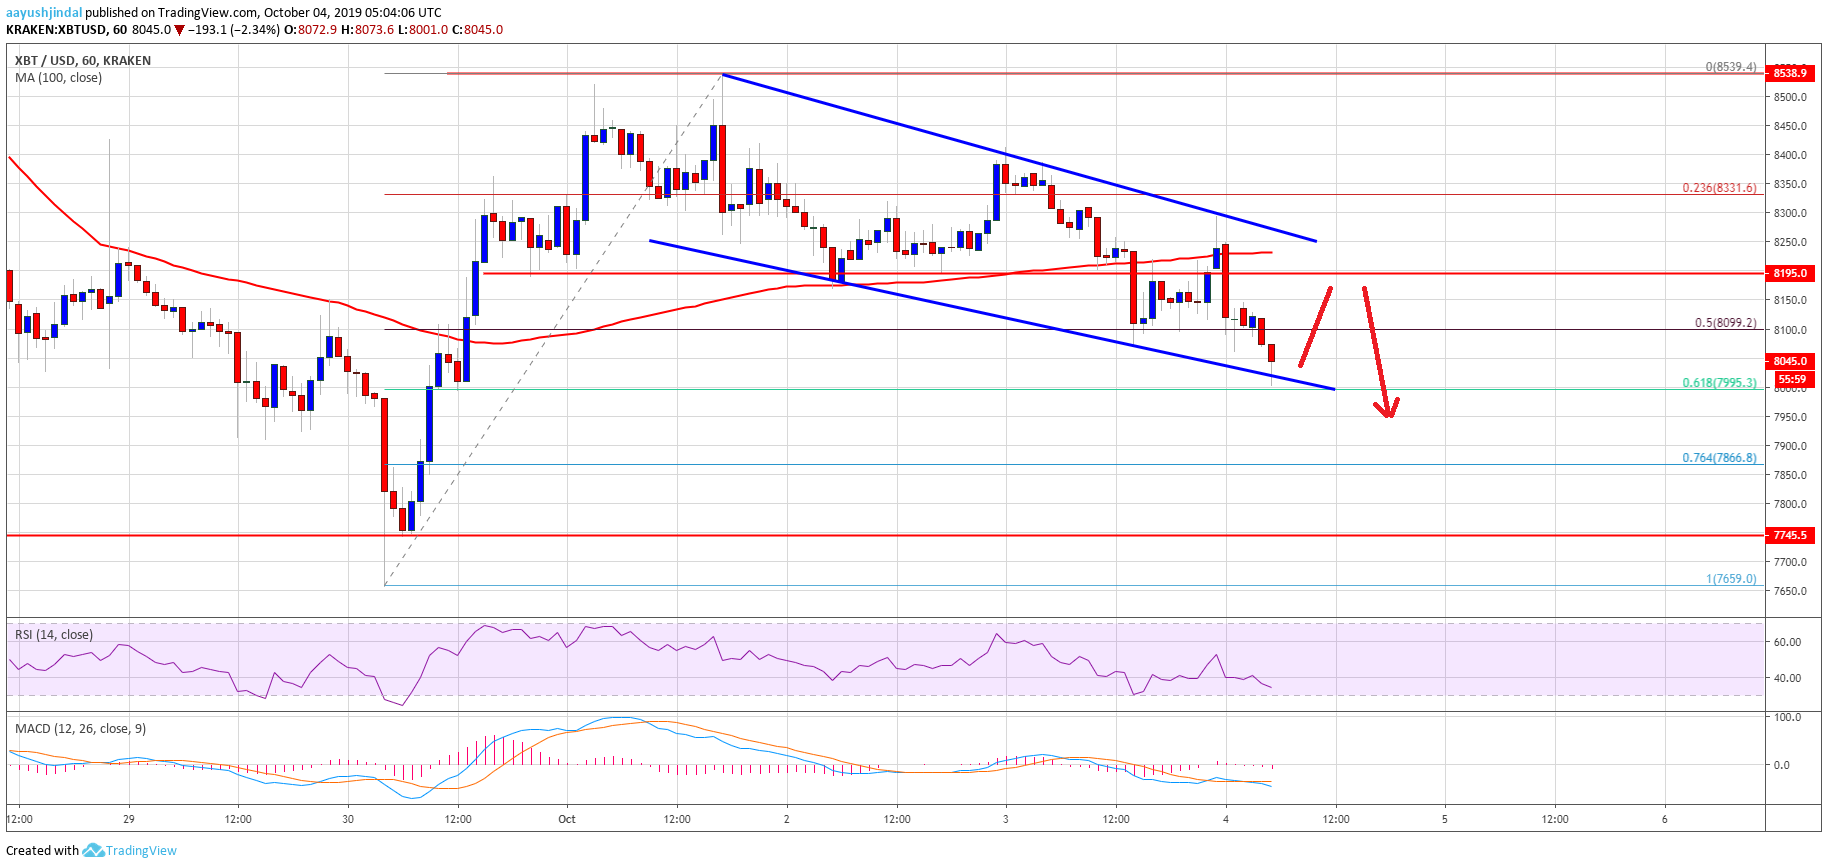
Looking at the chart, bitcoin is clearly struggling to climb above the $8,300 level. Therefore, there is a risk of a downside break below the $8,000 support. In the mentioned case, the price could test the $7,800 support or trade to a new monthly low before it starts a decent recovery towards $9,000.
Technical indicators:
Hourly MACD – The MACD is slowly gaining momentum in the bearish zone.
Hourly RSI (Relative Strength Index) – The RSI for BTC/USD is currently well below the 50 level.
Major Support Levels – $8,000 followed by $7,800.
Major Resistance Levels – $8,250, $8,300 and $8,500.


