
Reason to trust
How Our News is Made
Strict editorial policy that focuses on accuracy, relevance, and impartiality
Ad discliamer
Morbi pretium leo et nisl aliquam mollis. Quisque arcu lorem, ultricies quis pellentesque nec, ullamcorper eu odio.
- ETH price started trading in a range after it failed to surpass the $185 resistance against the US Dollar.
- The price is currently trading below the key $180 and $185 resistance levels.
- There is a key contracting triangle forming with resistance near $180 on the 4-hours chart of ETH/USD (data feed via Kraken).
- The pair is likely to make the next crucial move either above $180 or towards the $160 support.
Ethereum price is setting up for the next crucial break against the US Dollar and bitcoin. ETH may soon start a solid increase if it breaks the $180 and $185 resistances.
Ethereum Price Weekly Analysis
This past week, ETH tested the key $185 resistance area against the US Dollar. Earlier, the price formed a support base near the $160 level and started an upside correction. It broke the $165 and $170 resistance levels. Moreover, there was a break above the 23.6% Fib retracement level of the last major decline from the $225 high to $152 swing low.
However, the price struggled to break the $185 resistance area. Additionally, the 100 simple moving average (4-hours) acted as a strong resistance near $185. There was also no test the 50% Fib retracement level of the last major decline from the $225 high to $152 swing low. Recently, the price declined below the $180 level and it is currently trading in a crucial range.
It seems like there is a key contracting triangle forming with resistance near $180 on the 4-hours chart of ETH/USD. On the upside, there are major hurdles near the $180 and $185 levels. Therefore, a successful break above the $185 resistance area and the 100 SMA could open the doors for a larger upward move. The next key resistance for Ethereum is near the $198 and $200 levels.
Moreover, the 61.8% Fib retracement level of the last major decline from the $225 high to $152 swing low might prevent gains near $197. Conversely, the price could break the $170 support level to continue lower. The next key support area is near the $160 level. If there are more downsides, the price could revisit the $152 swing low.
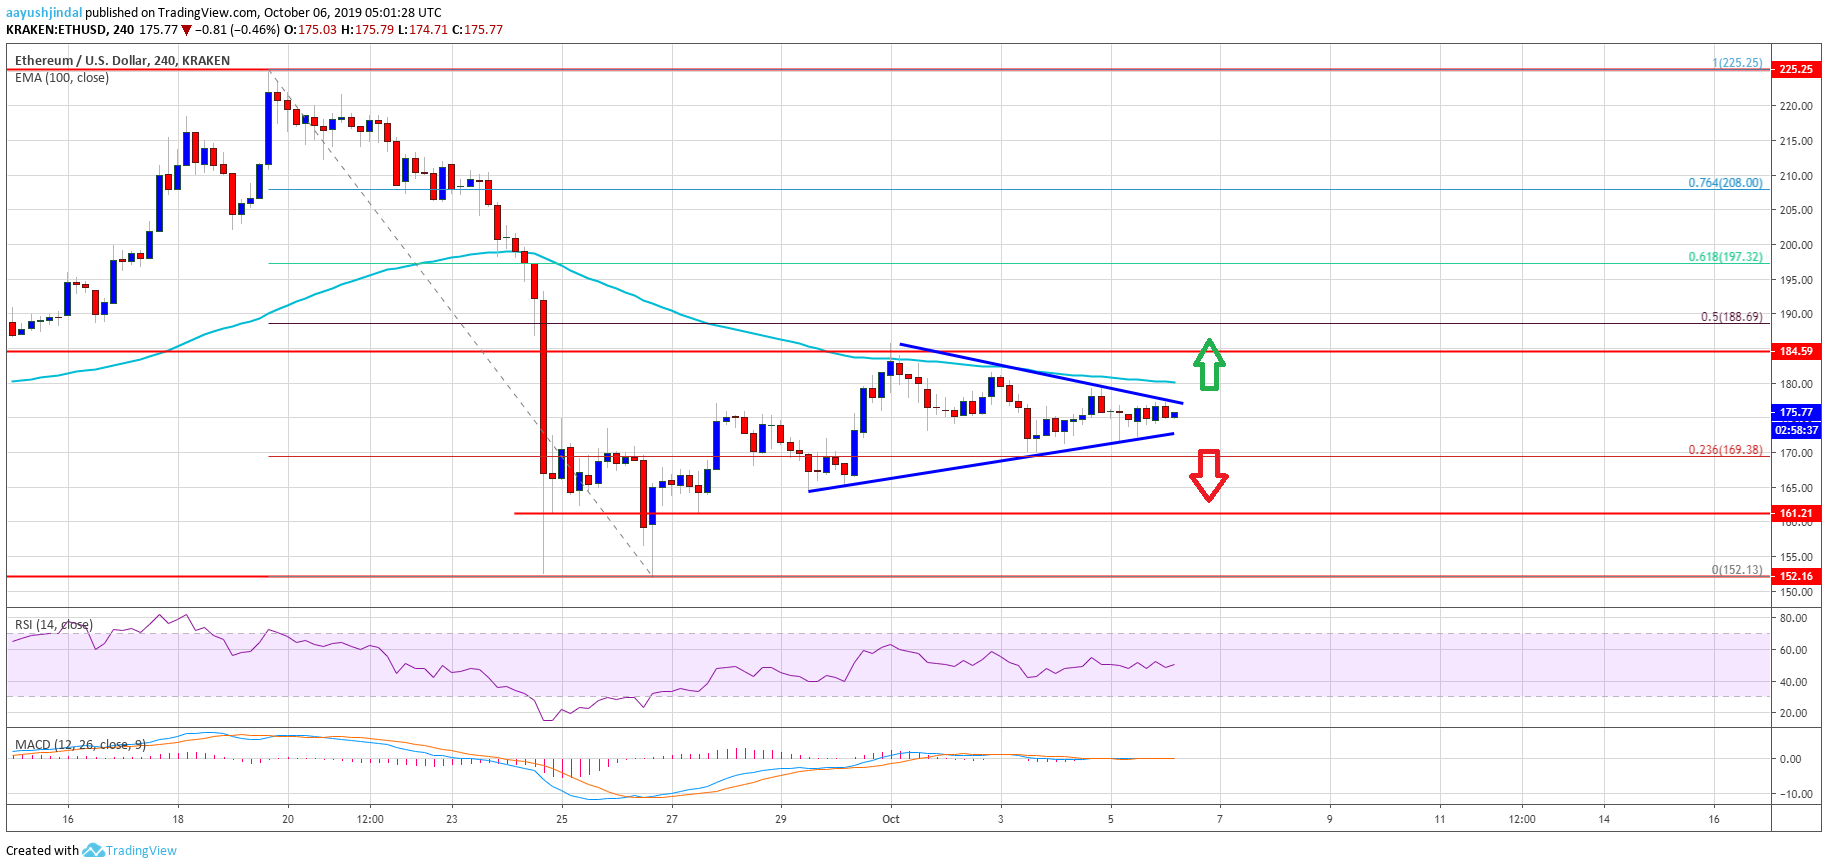
The above chart indicates that Ethereum price is clearly setting up for the next crucial break either above $185 or below $170. As long as the price is trading below the $185 resistance and the 100 SMA, there are chances of a downside break in the near term.
Technical Indicators
4 hours MACD – The MACD for ETH/USD is slowly moving into the bearish zone.
4 hours RSI – The RSI for ETH/USD is still well below the 50 level, with a flat structure.
Major Support Level – $170
Major Resistance Level – $185


