
Reason to trust
How Our News is Made
Strict editorial policy that focuses on accuracy, relevance, and impartiality
Ad discliamer
Morbi pretium leo et nisl aliquam mollis. Quisque arcu lorem, ultricies quis pellentesque nec, ullamcorper eu odio.
- ETH price is climbing higher and it recently broke the $175 and $180 resistances against the US Dollar.
- The price is currently trading near a crucial resistance area at $185 and $186.
- There was a break above a key bearish trend line with resistance near $175 on the hourly chart of ETH/USD (data feed via Kraken).
- The pair might correct a few points lower, but it is likely to climb higher towards $190 or $192.
Ethereum price is up close to 10% versus the US Dollar, and climbed nicely vs bitcoin. ETH price could soon attempt to surpass $185 and climb towards $192.
Ethereum Price Analysis
After forming a support base near $170, Ethereum started a decent rebound against the US Dollar. As a result, ETH price traded above the $175 and $180 resistance levels. Moreover, there was a close above the $180 level and the 100 hourly simple moving average. The price is currently up around 10% and it even tested the main $185 resistance, where the bears took a stand.
During the rise, there was a break above a key bearish trend line with resistance near $175 on the hourly chart of ETH/USD. The price is currently consolidating gains below the $185 resistance. An immediate support is near the $182 level. Moreover, the 23.6% Fib retracement level of the recent rise from the $167 low to $185 high is also near the $181 level.
If there is an extended decline or correction, the price could test the $178 and $175 support levels. The 50% Fib retracement level of the recent rise from the $167 low to $185 high is positioned near the $176 level to provide support in the near term. Any further losses might push the price back in a bearish zone towards the $170 support area.
On the upside, the main resistances are near the $185 and $186 level. The current price action suggests high chances of an upside break above the $185 resistance. In the mentioned case, the price could test the $190 and $192 resistance levels. The next key resistance area is near the $198 and $200 levels.
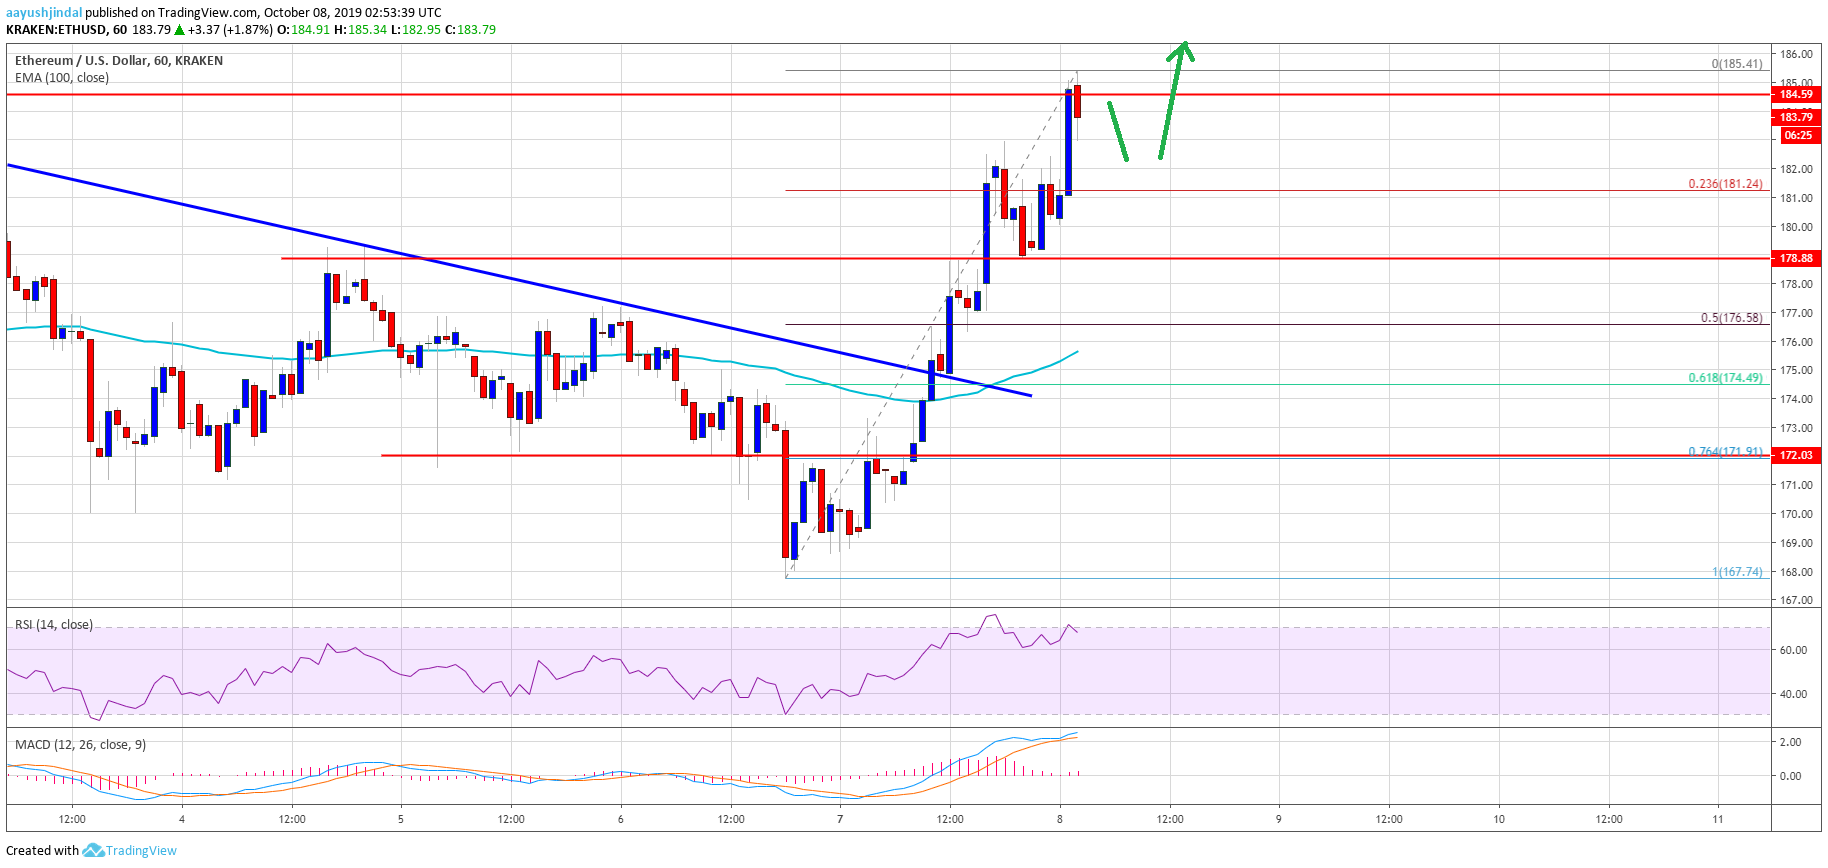
Looking at the chart, Ethereum price is trading with a nice bullish bias above the $180 level. Having said that, the bulls need to gain strength above the $185 and $186 resistance levels to push the price into an uptrend. If not, there are chances of a fresh decline towards the $175 level.
ETH Technical Indicators
Hourly MACD – The MACD for ETH/USD is slowly losing pace in the bullish zone.
Hourly RSI – The RSI for ETH/USD is currently correcting lower towards the 60 level.
Major Support Level – $180
Major Resistance Level – $185


