
Reason to trust
How Our News is Made
Strict editorial policy that focuses on accuracy, relevance, and impartiality
Ad discliamer
Morbi pretium leo et nisl aliquam mollis. Quisque arcu lorem, ultricies quis pellentesque nec, ullamcorper eu odio.
- Bitcoin price is down more than 8% and it dived below $7,500 against the US Dollar.
- The price is currently correcting higher after trading to a new monthly low near $7,300
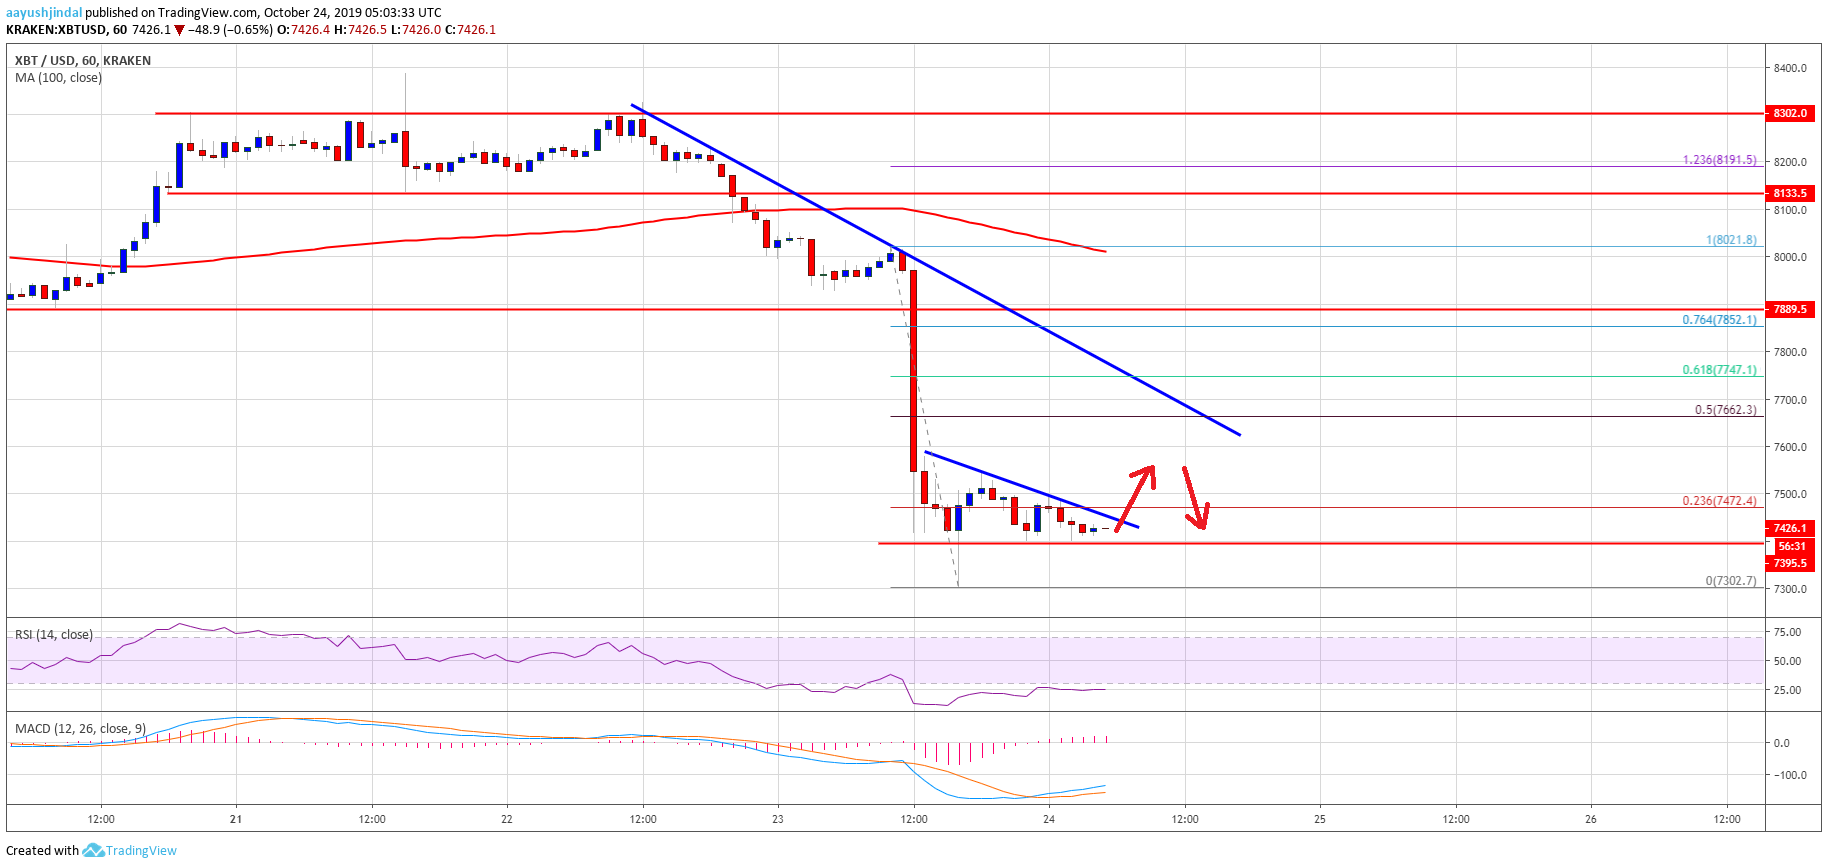
- There are two connecting bearish trend lines forming with resistance near $7,450 and $7,660 on the hourly chart of the BTC/USD pair (data feed from Kraken).
- The price is trading near key supports and it could correct higher towards $7,660 and $7,700.
Bitcoin price is down around $1,000 this week against the US Dollar. BTC bears need to be careful as there could be a nice recovery in the near term.
Bitcoin Price Analysis
This week, bitcoin failed to clear the $8,300 resistance area against the US Dollar. BTC price started a fresh decline and broke many support near the $8,000 handle.
As a result, the bears took control and the price dived more than 8% in the past three sessions. It broke the $7,800 and $7,600 supports levels. Moreover, there was a clear break below $7,500 and the price settled below the 100 hourly simple moving average.
Finally, a new monthly low was formed near $7,302 and the price is currently correcting higher. It recovered above the $7,400 level, plus the 23.6% Fib retracement level of the recent decline from the $8,021 high to $7,302 low.
At the moment, the price is consolidating above the $7,400 and is facing hurdles. An immediate resistance is near the $7,440 level. Additionally, there are two connecting bearish trend lines forming with resistance near $7,450 and $7,660 on the hourly chart of the BTC/USD pair.
The second trend line coincides with the 50% Fib retracement level of the recent decline from the $8,021 high to $7,302 low. If there is an upside break above the $7,660 resistance, the price could recover towards the $7,800 and $7,880 resistance levels (the previous supports).
On the downside, the $7,380 level is an immediate support. If there is a downside break below $7,380, the price could revisit the $7,300 support area. Any further losses are likely to call for a push towards the $7,200 and $7,120 levels.
Looking at the chart, bitcoin is facing a strong selling interest below $7,800. Having said that, the price is down more than $1,000 this week, which means any further losses might be limited. Therefore, there are chances of an upside correction towards $7,660 and $7,800 in the coming sessions.
Technical indicators:
Hourly MACD – The MACD is slowly moving in the bullish zone.
Hourly RSI (Relative Strength Index) – The RSI for BTC/USD is still well below the 30 level.
Major Support Levels – $7,380 followed by $7,300.
Major Resistance Levels – $7,440, $7,660 and $7,800.


