
Reason to trust
How Our News is Made
Strict editorial policy that focuses on accuracy, relevance, and impartiality
Ad discliamer
Morbi pretium leo et nisl aliquam mollis. Quisque arcu lorem, ultricies quis pellentesque nec, ullamcorper eu odio.
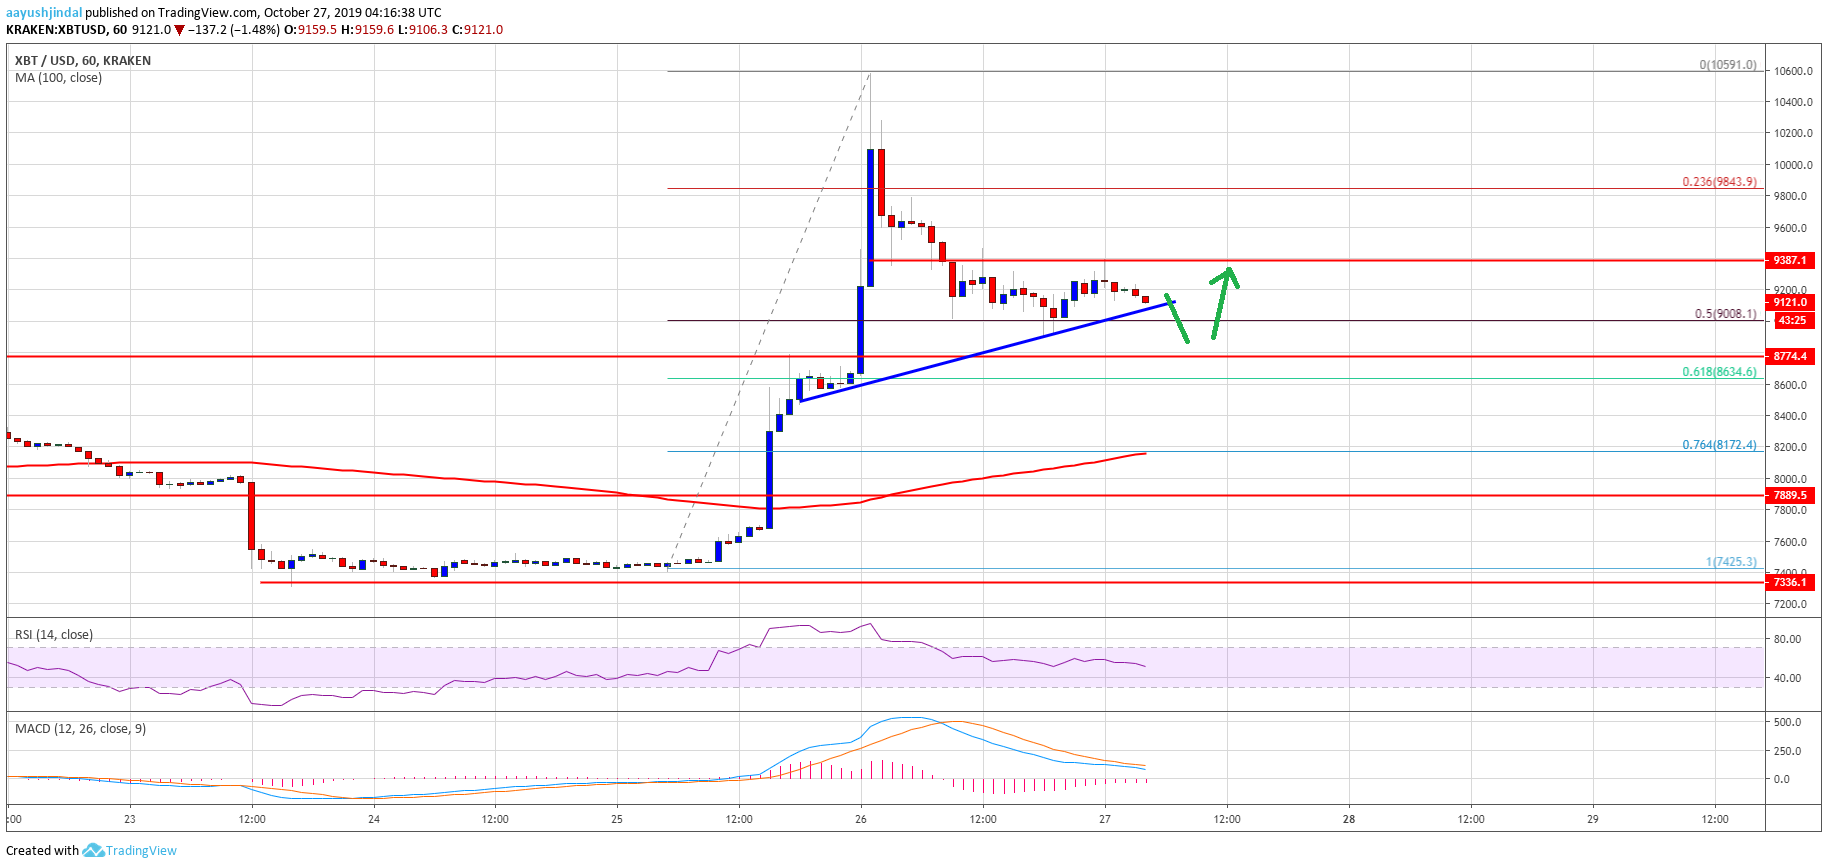
- There was a strong rise in bitcoin price from above $8,000 and $9,000 against the US Dollar.
- The price even spiked above the $10,000 resistance, but it failed to hold gains and declined.
- There is a short term bullish trend line forming with support near $9,080 on the 4-hours chart of the BTC/USD pair (data feed from Kraken).
- The price could bounce back as long as it is trading above the $8,600 and $8,500 support levels.
Bitcoin price is trimming gains after a sharp rally against the US Dollar. BTC must stay above $8,500 to start a fresh increase. If not, it could dive back to $8,000.
Bitcoin Price Weekly Analysis (BTC)
In the past two days, there were heavy swing moves in BTC from the $7,500 support against the US Dollar. The BTC/USD pair rallied more than 20% and broke many hurdles near $8,500 and $9,000.
Moreover, there was a close above the $8,500 resistance area and the 100 simple moving average (4-hours). Finally, the price rallied above the $10,000 resistance and traded close to the $10,600 resistance area.
However, the bulls failed to remain in control and a top was formed near $10,591. Later, there was a strong downside correction below the $10,000 level. The price traded below the 23.6% Fib retracement level of the rally from the $7,425 swing low to $10,591 high.
Besides, the price traded below $9,500 and tested the $9,000 support area. Besides, it seems like the 50% Fib retracement level of the rally from the $7,425 swing low to $10,591 high is currently acting as a strong support.
More importantly, there is a short term bullish trend line forming with support near $9,080 on the 4-hours chart of the BTC/USD pair. If there is a downside break below the trend line and $9,000, bitcoin price could test the next major support near the $8,600 area.
The $8,600 and $8,500 levels are crucial supports since they acted as hurdles previously. Additionally, the 61.8% Fib retracement level of the rally from the $7,425 swing low to $10,591 high might also provide support.
Therefore, the $8,500 support is likely to act as a major support. If the price fails to stay above $8,500, it could move back into a downtrend.
Looking at the chart, bitcoin price is clearly trimming gains and approaching a few key supports near $9,000 and $8,600. If it fails to stay above $8,500, the recent rally could completely reverse in the coming days.
Technical indicators
4 hours MACD – The MACD for BTC/USD is slowly moving in the bearish zone.
4 hours RSI (Relative Strength Index) – The RSI for BTC/USD is moving lower and is close to the 50 level.
Major Support Level – $8,500
Major Resistance Level – $9,500


