
Reason to trust
How Our News is Made
Strict editorial policy that focuses on accuracy, relevance, and impartiality
Ad discliamer
Morbi pretium leo et nisl aliquam mollis. Quisque arcu lorem, ultricies quis pellentesque nec, ullamcorper eu odio.
- Ethereum price declined recently and traded below the $180 support area against the US Dollar.
- Bitcoin is under pressure and it seems to be struggling to stay above the $9,000 support.
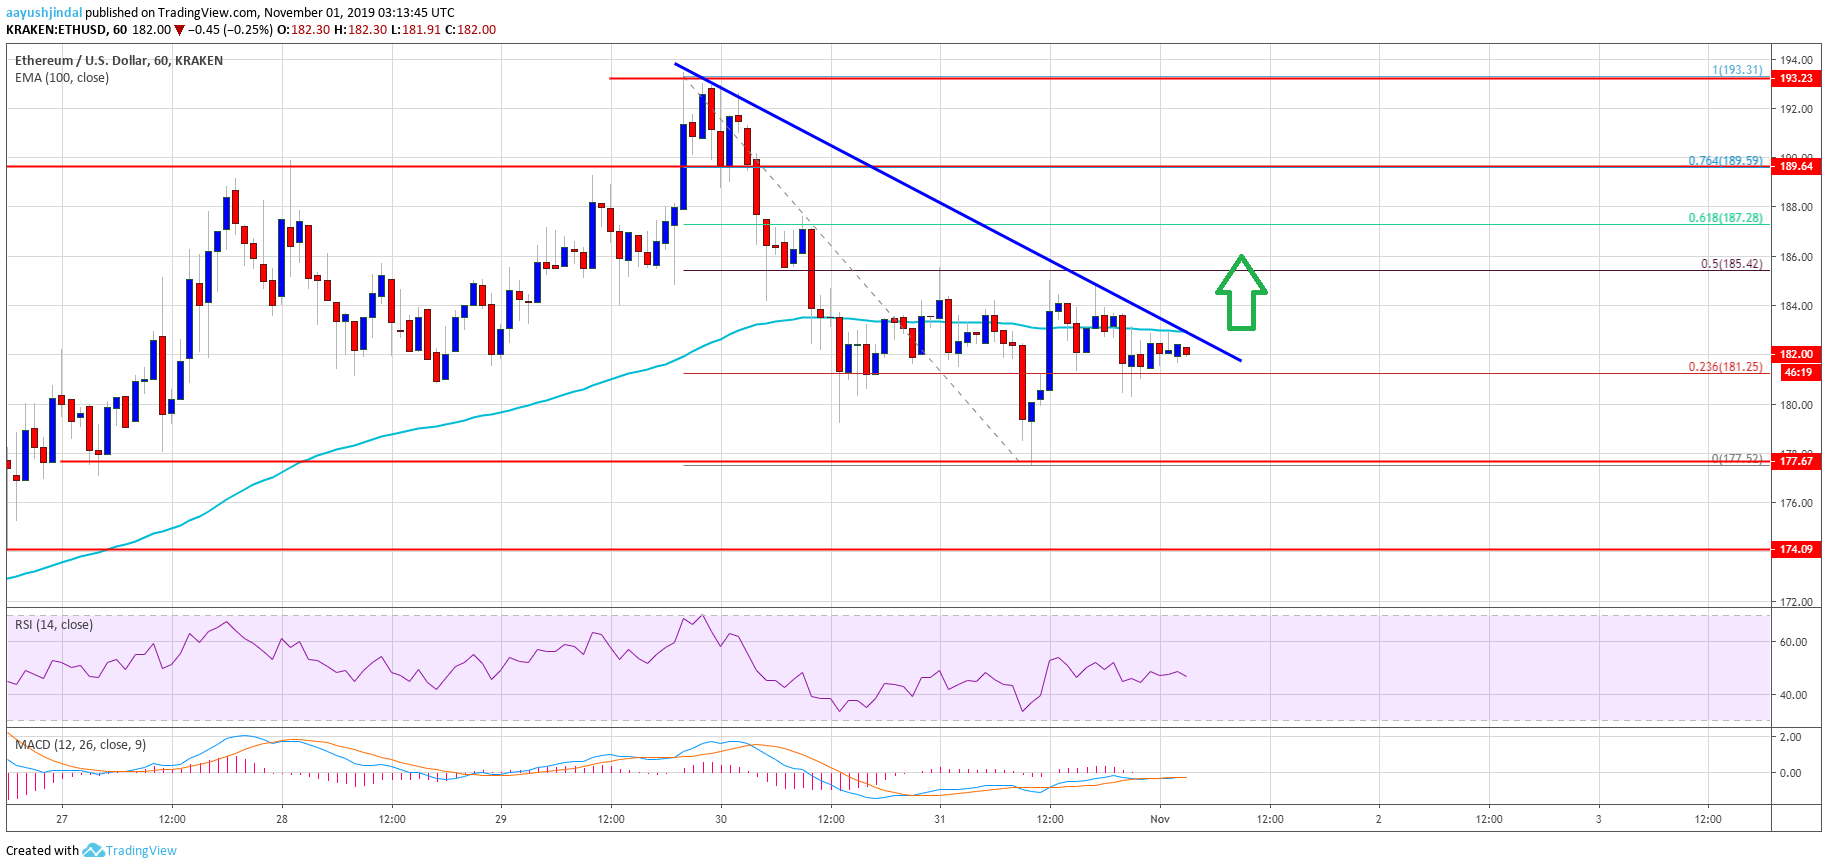
- There is a new connecting bearish trend line forming with resistance near $183 on the hourly chart of ETH/USD (data feed via Kraken).
- The pair could start a decent upward move if it breaks the $183 and $185 resistance levels.
Ethereum price is showing a few bearish signs versus the US Dollar, similar to bitcoin. However, ETH price is likely to find a strong support near the $175 level.
Ethereum Price Analysis
In the past few sessions, there was a steady decline in Ethereum below the $185 support area against the US Dollar. Moreover, there was a close below the $185 level and the 100 hourly simple moving average.
Finally, ETH spiked below the $180 support and traded to a new intraday low near $177. Recently, there was an upside correction above the $180 and $182 levels.
Ethereum price managed to move above the 23.6% Fib retracement level of the recent drop from the $194 high to $177 low. However, the previous support near the $185 area acted as a resistance and prevented an upside break.
Besides, the pair failed to test the 50% Fib retracement level of the recent drop from the $194 high to $177 low. More importantly, there is a new connecting bearish trend line forming with resistance near $183 on the hourly chart of ETH/USD.
The 100 hourly SMA is also near the $183 level. Therefore, an upside break above the $183 level might push the price above the $185 resistance. The next key resistance is near the $188 level, followed by $190.
On the downside, an immediate support is near the $178 level. The main support is near the $175 level, where the bulls are likely to take a stand. If there is a downside break below the $175 level, there are chances of more losses below the $172 and $170 levels.
Looking at the chart, Ethereum price is struggling to hold the $180 and $178 supports. It could either break the $185 resistance or extend losses below the $175 support. Having said that, a clear break below the $175 support won’t be easy in the coming sessions. Below $175, the next buy zone could be near the $165 area.
ETH Technical Indicators
Hourly MACD – The MACD for ETH/USD is slowly gaining pace in the bearish zone.
Hourly RSI – The RSI for ETH/USD is currently decline and it is moving lower towards the 40 level.
Major Support Level – $175
Major Resistance Level – $185


