
Reason to trust
How Our News is Made
Strict editorial policy that focuses on accuracy, relevance, and impartiality
Ad discliamer
Morbi pretium leo et nisl aliquam mollis. Quisque arcu lorem, ultricies quis pellentesque nec, ullamcorper eu odio.
- Ripple price is showing bearish signs and recently declined below $0.2980 against the US dollar.
- The price is currently consolidating losses above $0.2850 after it traded as low as $0.2746.
- There is a short term breakout pattern forming with resistance near $0.2910 on the hourly chart of the XRP/USD pair (data source from Kraken).
- If there is a downside break, the price could revisit the $0.2800 support level.
Ripple price declined sharply in the past three sessions against the US Dollar and bitcoin. XRP price is consolidating losses and it could face a strong resistance near $0.2980.
Ripple Price Analysis
Yesterday, we saw a steady rise in ripple above the $0.3000 resistance area against the US Dollar. Moreover, XRP climbed above the $0.3050 and $0.3120 levels.
However, the $0.3150 area prevented more upsides and a high was formed near $0.3149. As a result, there was a nasty decline below the $0.3050 and $0.3000 support levels. More importantly, there was a break below a connecting bullish trend line with support near $0.3000 on the hourly chart of the XRP/USD pair.
Finally, ripple dived below the $0.2980 support area and the 100 hourly simple moving average. It opened the doors for more losses and the price traded below $0.2800.
A low was formed near $0.2746 and the price later recovered above $0.2800. Besides, there was a break above the 23.6% Fib retracement level of the recent decline from the $0.3149 high to $0.2746 low.
At the outset, the price is consolidating losses above the $0.2850 support area. Additionally, there is a short term breakout pattern forming with resistance near $0.2910 on the same chart.
If there is a downside break below the $0.2880 support, there is a risk of more losses below the $0.2850 support area. The next key support is near the $0.2800 level, below which ripple could revisit the $0.2750 area.
Conversely, the price could correct further above $0.2900. The next key resistance is near $0.2950. It coincides with the 50% Fib retracement level of the recent decline from the $0.3149 high to $0.2746 low. The main resistance area is near $0.2980 and the 100 hourly SMA.
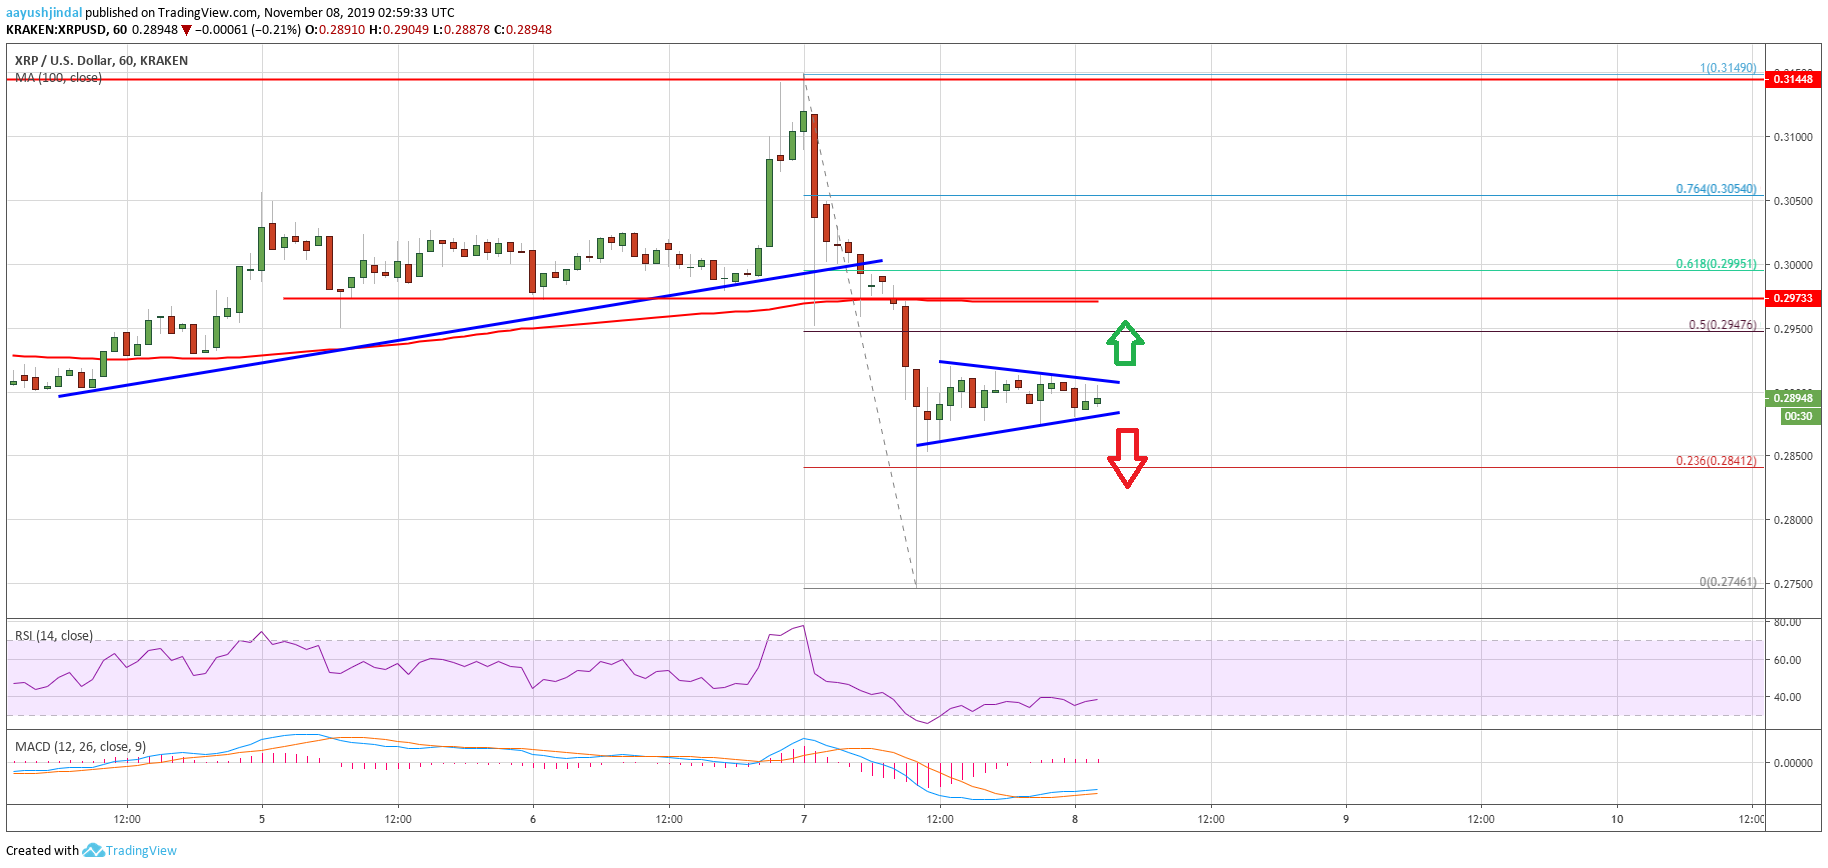
Looking at the chart, ripple price is clearly consolidating losses above the $0.2850 area. To start a fresh increase, it must break the $0.2950 and $0.2980 resistance levels. If not, it could resume its decline below $0.2850 and $0.2800.
Technical Indicators
Hourly MACD – The MACD for XRP/USD is slowly moving in the bullish zone.
Hourly RSI (Relative Strength Index) – The RSI for XRP/USD is slowly climbing higher towards the 45 level.
Major Support Levels – $0.2880, $0.2850 and $0.2800.
Major Resistance Levels – $0.2900, $0.2950 and $0.2980.


