
Reason to trust
How Our News is Made
Strict editorial policy that focuses on accuracy, relevance, and impartiality
Ad discliamer
Morbi pretium leo et nisl aliquam mollis. Quisque arcu lorem, ultricies quis pellentesque nec, ullamcorper eu odio.
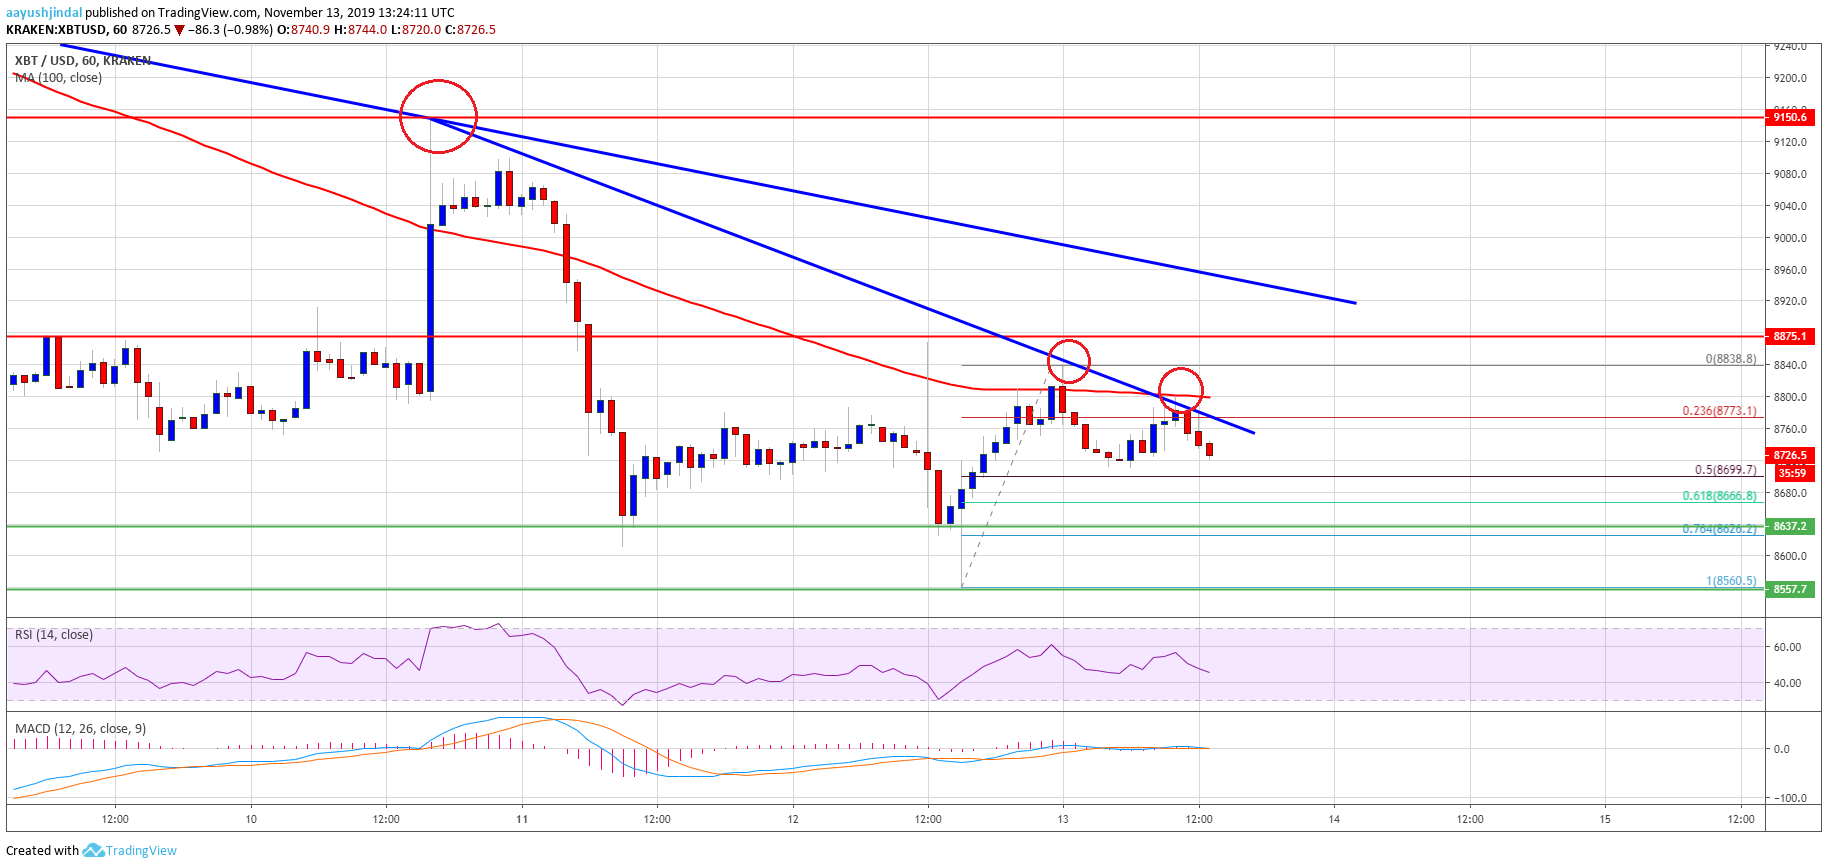
- Bitcoin price is struggling to recover above $8,800 and $8,840 against the US Dollar.
- The price is slowly moving lower and it is likely to decline sharply below $8,600.
- Morning’s bearish trend line is active with resistance near $8,775 on the hourly chart of the BTC/USD pair (data feed from Kraken).
- It seems like there could be a nasty decline below $8,600 before the price starts a decent recovery.
Bitcoin price is still trading in a downtrend below $8,800 against the US Dollar. BTC needs to settle above the $8,920 and the 100 hourly SMA to start a recovery.
Bitcoin Price Analysis
In morning, we saw an upside correction in bitcoin from the $8,560 swing low against the US Dollar. However, BTC faced a strong resistance near the $8,800 level and the 100 hourly simple moving average.
There was another decline below the $8,750 level. Moreover, the price broke the 23.6% Fib retracement level of the upward move from the $8,560 low to $8,839 high. The price even broke the $8,720 level, but it stayed above the $8,700 level.
It seems like the 50% Fib retracement level of the upward move from the $8,560 low to $8,839 high is acting as a support. Recently, bitcoin price made another attempt to clear the $8,800 resistance and the 100 hourly simple moving average, but it failed.
More importantly, morning’s bearish trend line is active with resistance near $8,775 on the hourly chart of the BTC/USD pair. The pair is once again declining and is trading below the $8,750 level.
If the price fails to stay above the $8,700 level, it could continue to move down. The next support is near the $8,640 level. It represents the 61.8% Fib retracement level of the upward move from the $8,560 low to $8,839 high.
It seems like bitcoin is setting up for a downward spike below the $8,600 support area. Additionally, it could even spike below the $8,500 support area before the bulls take a stand.
Conversely, the price is likely to struggle near many resistances, starting with $8,800. The main resistance is near $8,900 and another important bearish trend line on the same chart. For that reason, a close above $8,920 is needed for a decent recovery.
Looking at the chart, bitcoin is clearly declining and it could soon dive below the $8,650 and $8,600 level. Once the current wave is complete, the price might recover above $8,850 and $9,000.
Technical indicators:
Hourly MACD – The MACD is slowly moving in the bearish zone.
Hourly RSI (Relative Strength Index) – The RSI for BTC/USD is sliding and it is well below the 50 level.
Major Support Levels – $8,640 followed by $8,600.
Major Resistance Levels – $8,800, $8,850 and $8,920.


