
Reason to trust
How Our News is Made
Strict editorial policy that focuses on accuracy, relevance, and impartiality
Ad discliamer
Morbi pretium leo et nisl aliquam mollis. Quisque arcu lorem, ultricies quis pellentesque nec, ullamcorper eu odio.
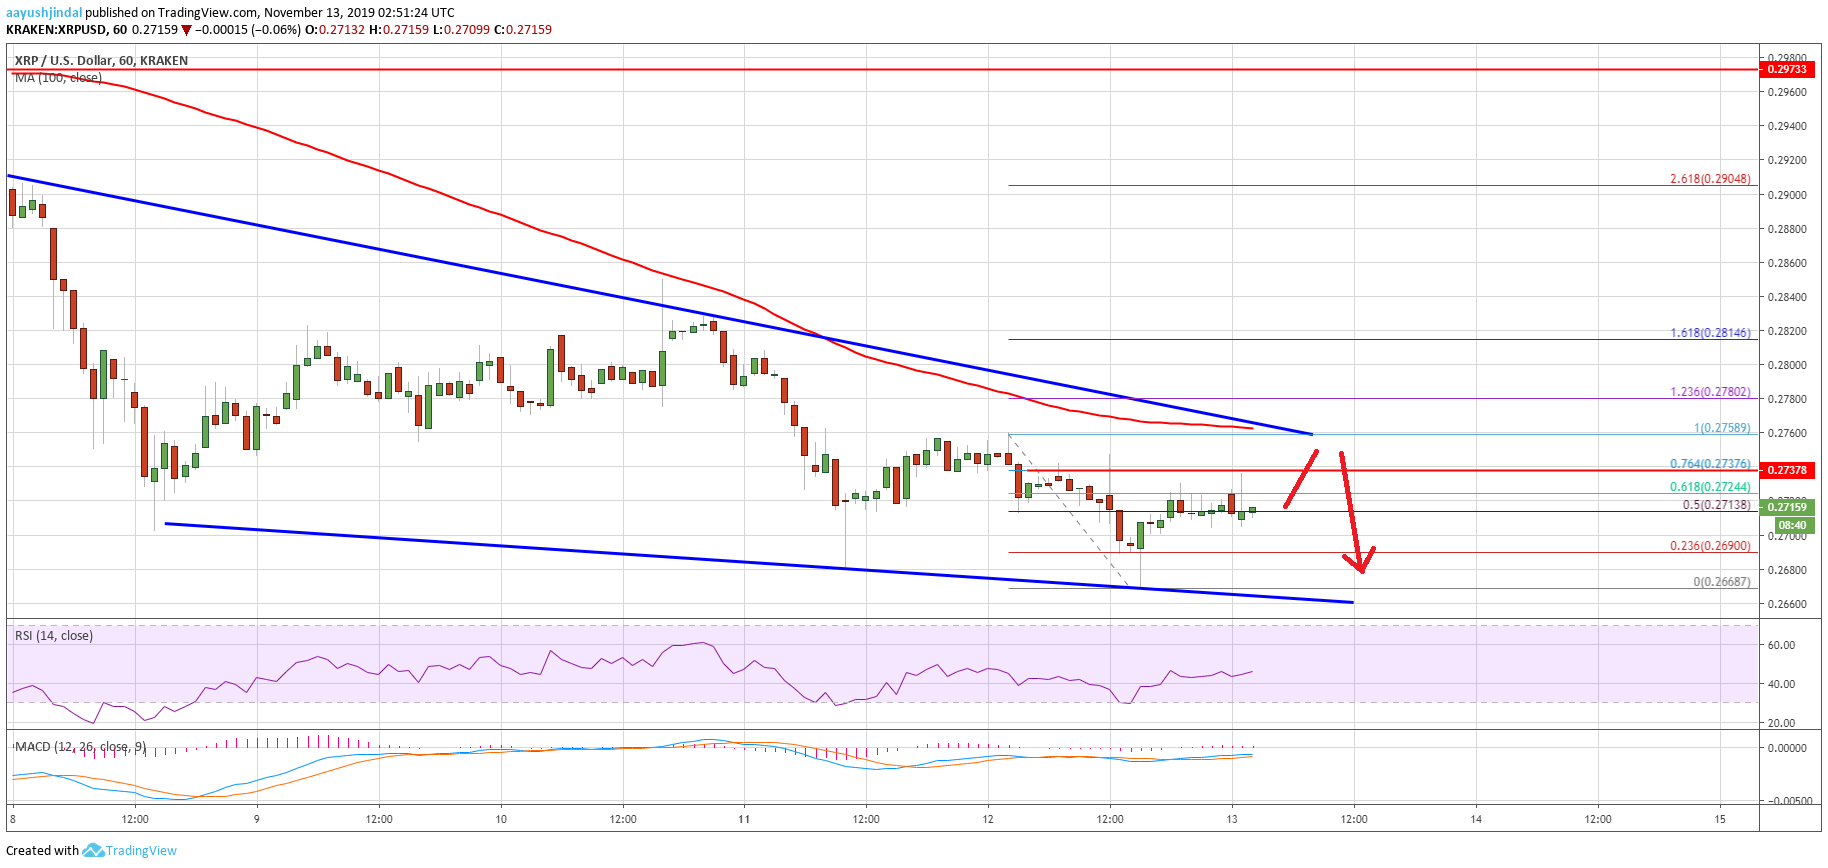
- Ripple price is trading in a downtrend below the $0.2750 resistance against the US dollar.
- The price is facing a lot of hurdles on the upside near the $0.2740 and $0.2750 levels.
- This week’s crucial bearish trend line is intact with resistance near $0.2800 on the hourly chart of the XRP/USD pair (data source from Kraken).
- Besides, Ethereum is still holding the key $182 and $180 support levels.
Ripple price is struggling to recover and trading in a bearish zone against the US Dollar and bitcoin. XRP price remains at a risk of more losses below $0.2660.
Ripple Price Analysis
In the past few days, ripple followed a bearish path below the $0.2900 resistance area against the US Dollar. Moreover, XRP/USD settled below the key $0.2800 area and the 100 hourly simple moving average.
It opened the doors for more downsides below the $0.2750 support area. Recently, the price traded below the last swing low near $0.2680 and declined below $0.2670. A new monthly low was formed near $0.2668 and the price is currently correcting higher.
It broke the $0.2700 and $0.2710 resistance levels. Additionally, ripple climbed above the 50% Fib retracement level of the recent drop from the $0.2758 high to $0.2668 low.
However, the price seems to be facing a lot of hurdles on the upside near the $0.2740 and $0.2750 levels. More importantly, this week’s crucial bearish trend line is intact with resistance near $0.2800 on the hourly chart of the XRP/USD pair.
Furthermore, the 61.8% Fib retracement level of the recent drop from the $0.2758 high to $0.2668 low is also acting as a resistance. Therefore, a clear break above the $0.2740 and $0.2750 resistance levels is needed for more gains in the near term.
Once there is a clear break above $0.2750 and the 100 hourly SMA, the price could recover towards the $0.2820 and $0.2850 resistance levels. On the downside, an initial support is near the $0.2660 level. If the bulls fail to defend the $0.2660 and $0.2650 support levels, the next stop for the bears may perhaps be $0.2620.
Looking at the chart, ripple price is clearly struggling below $0.2800 and $0.2750. A downtrend is in place and it seems like there are chances of more losses below the $0.2650 support level. In the mentioned case, the main support where the bulls may take a stand could be $0.2580.
Technical Indicators
Hourly MACD – The MACD for XRP/USD is showing no signs of a decent recovery in the bearish zone.
Hourly RSI (Relative Strength Index) – The RSI for XRP/USD is currently just below the 50 level.
Major Support Levels – $0.2660, $0.2650 and $0.2620.
Major Resistance Levels – $0.2740, $0.2750 and $0.2820.


