Reason to trust
How Our News is Made
Strict editorial policy that focuses on accuracy, relevance, and impartiality
Ad discliamer
Morbi pretium leo et nisl aliquam mollis. Quisque arcu lorem, ultricies quis pellentesque nec, ullamcorper eu odio.
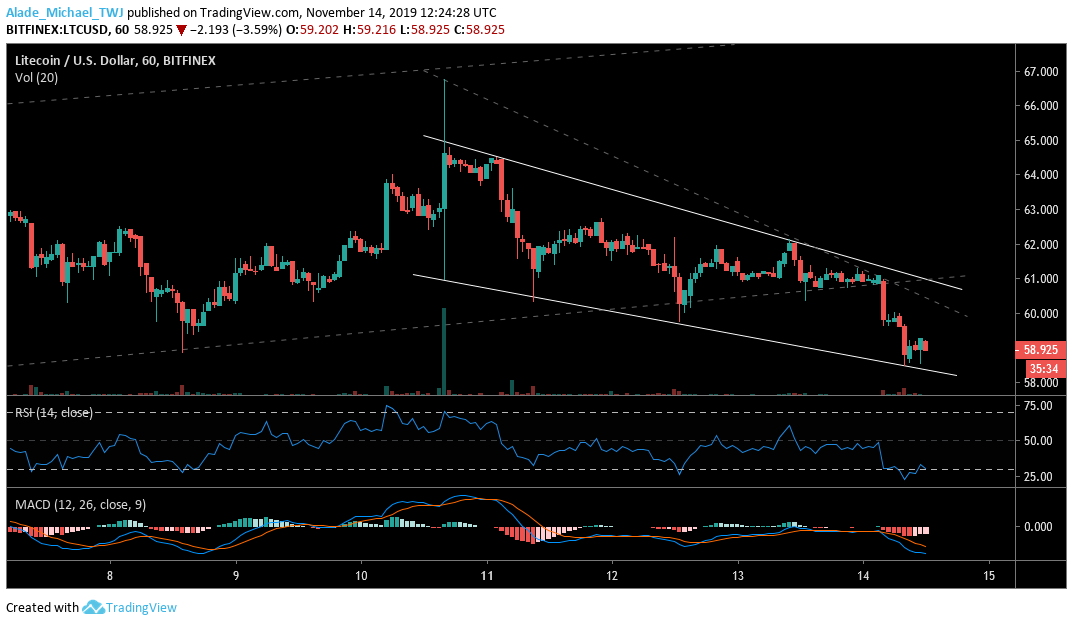
- LTC broke out of a channel to a new descending wedge after dropping below $61 price levels earlier today.
- The price rejection at $66 price levels has made Litecoin stay under a bearish pressure since the weekly opening.
- Litecoin may gain bullish momentum if the price can reclaim $61, which appeared to be a critical confluence zone for the market.
Litecoin has witnessed a lot of price reductions over the past three days due to a significant correction which is making the bears gain control of the market.
However, a bullish step back is expected for LTC, once it climbs back above $60 price level, although the $61 resistance is an essential level for the next bullish phase on the hourly chart.
Litecoin (LTC) Price Analysis
Following November 10, rejection at $66, Litecoin has remained in a downward range. The latest bearish scenario has caused LTC to trade inside a descending wedge, but the price is now sitting on the lower boundary of the wedge.
Therefore, a retracement could be underway to the upper boundary of the wedge at $60. A break above the wedge could allow the bulls to regain control of the market. This could bring the next resistance levels at $62, followed by a decent rally to $64.6 resistance levels.
Litecoin is currently holding near support at $58. This support could become weak if we continue to witness a devastating price drop.
However, we may need to keep an eye on the $57 and $56 supports in the next swing low. Additionally, Litecoin is still showing a bullish sign on the daily chart.
Litecoin to Enter the Bullish Trend
The market structure looks bullish on the higher time frame, but, the lower time frame is currently suggesting a bearish mode for Litecoin.
Meanwhile, the last three days’ downward direction is just a sign of a small pullback on the daily chart. We can expect a bullish continuation in the next couple of days. Otherwise, we may continue to see a decline until Litecoin finds vital support for a rebound.
Technical Indicator Reading:
Hourly RSI (Relative Strength Index) – The RSI for Litecoin has dropped to the extremely oversold region but has recovered a bit to the 30 levels.
Hourly MACD (Moving Average Convergence and Divergence) – The MACD for Litecoin is currently negative to show a bearish momentum
Key resistance levels: $60, $62, $64.6
Key support levels: $58, $57, $56


