
Reason to trust
How Our News is Made
Strict editorial policy that focuses on accuracy, relevance, and impartiality
Ad discliamer
Morbi pretium leo et nisl aliquam mollis. Quisque arcu lorem, ultricies quis pellentesque nec, ullamcorper eu odio.
- ETH price is facing a strong resistance near the $184 and $185 levels against the US Dollar.
- The price is trading above the key $178 support, which remains at a risk.
- There is a crucial bearish trend line forming with resistance near $186 on the 4-hours chart of ETH/USD (data feed via Kraken).
- The pair is currently declining and it might struggle to clear the $178 and $176 support levels.
Ethereum price is showing bearish signs below $185 against the US Dollar, similar to bitcoin. ETH price remains at a risk of a downside break below the $176 support area.
Ethereum Price Weekly Analysis
This past week, Ethereum retested the key $190 resistance area against the US Dollar. However, ETH price failed to continue higher, resulting in a fresh decline below the $188 support area.
Moreover, there was a break below the key $186 support area. Finally, there was a close below the $184 support and the 100 simple moving average (4-hours). The bears gained pace below the $180 level and a low was formed near the $177 level.
It seems like the $176-$178 support area is playing a crucial role for the bulls. Recently, there was an upside correction above the $180 level. Furthermore, there was a break above the 23.6% Fib retracement level of the downward move from the $190 swing high to $177 low.
On the upside, Ethereum price seems to be facing a strong resistance near the $184 level and the 100 SMA. The 50% Fib retracement level of the downward move from the $190 swing high to $177 low is also near the $184 level.
More importantly, there is a crucial bearish trend line forming with resistance near $186 on the 4-hours chart of ETH/USD. Therefore, the price is likely to face a strong resistance, starting with $184 and up to $186.
Having said that, the price must settle above the $188 and $190 resistance levels to move into a positive zone. The next key resistances are near the $200 and $205 levels.
On the downside, there are many key supports near the $178 and $176 levels. If there is a daily close below the $176 support, the price could decline heavily. The next major support are near the $165 and $160 levels.
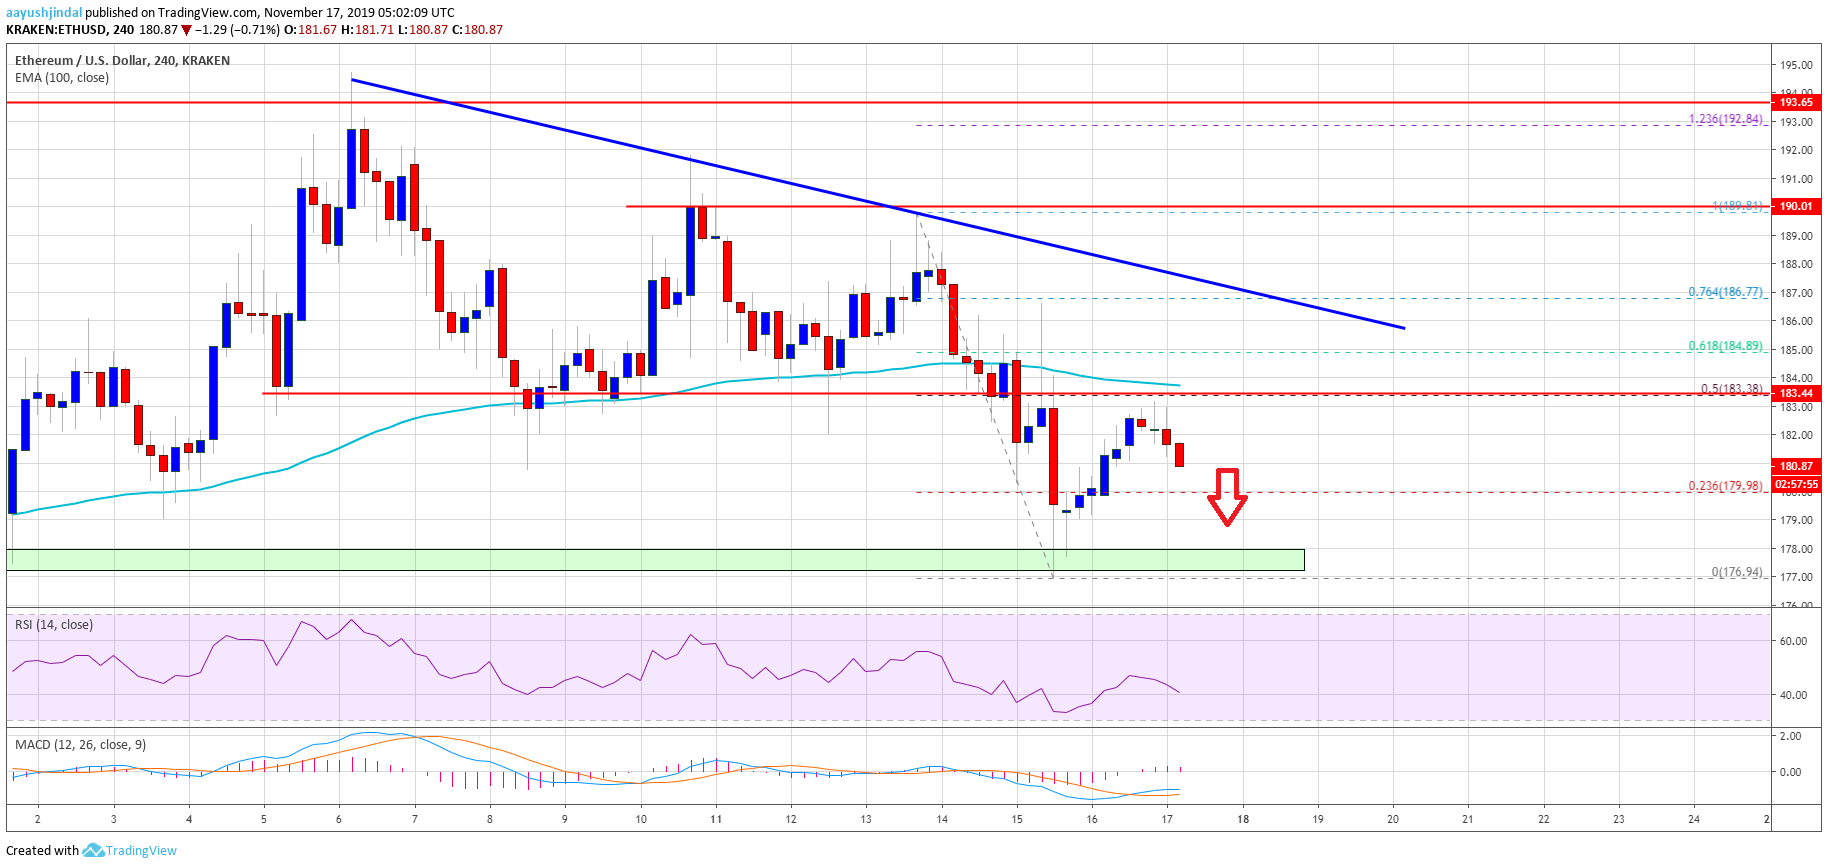
The above chart indicates that Ethereum price is clearly declining towards the $176 support area. Thus, it might either recover nicely above $185 or extend its decline towards $165.
Technical Indicators
4 hours MACD – The MACD for ETH/USD is slowly moving into the bearish zone.
4 hours RSI – The RSI for ETH/USD is currently below the 50 level, with a bearish angle.
Major Support Level – $176
Major Resistance Level – $188


