
Reason to trust
How Our News is Made
Strict editorial policy that focuses on accuracy, relevance, and impartiality
Ad discliamer
Morbi pretium leo et nisl aliquam mollis. Quisque arcu lorem, ultricies quis pellentesque nec, ullamcorper eu odio.
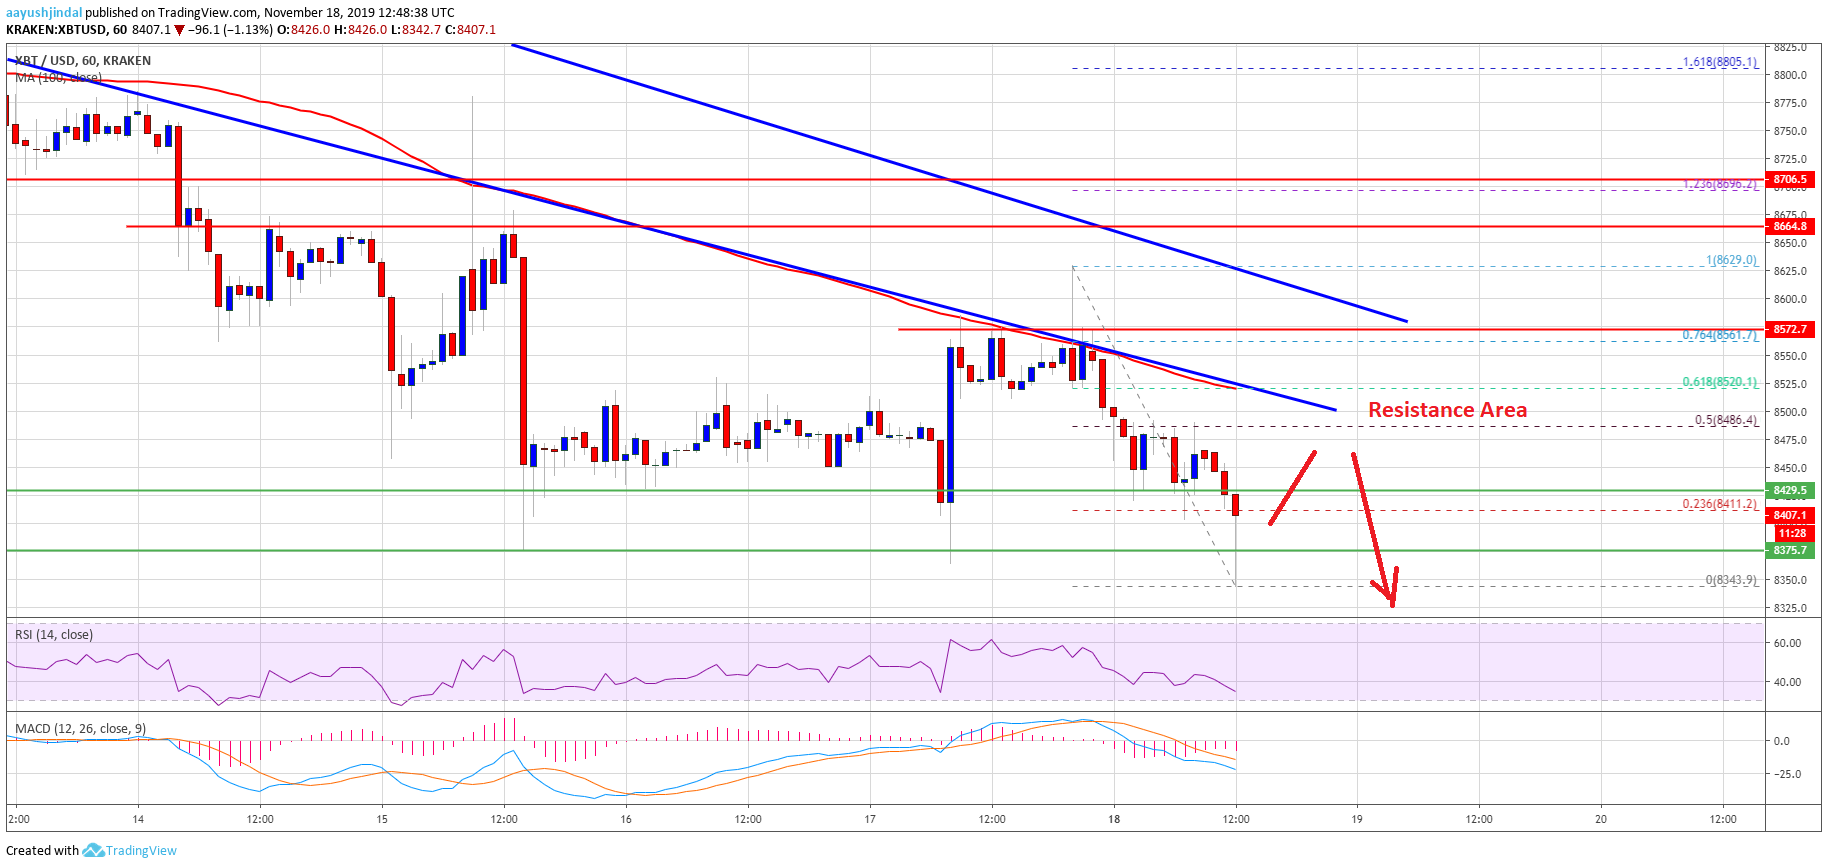
- Bitcoin price is extending losses and it recently broke $8,375 support against the US Dollar.
- The price is currently correcting, but upsides are likely to be capped by $8,500.
- Morning’s key bearish trend line is active with resistance near $8,500 on the hourly chart of the BTC/USD pair (data feed from Kraken).
- Ethereum is still holding the $180 support area and ripple is trading in a range above $0.2520.
Bitcoin price is showing signs of more losses below $8,500 against the US Dollar. BTC could drop towards $8,200 before a decent increase in the near term.
Bitcoin Price Analysis
In morning, we saw a few bearish signs for bitcoin below the $8,660 and $8,700 resistances against the US Dollar. BTC failed to climb above the $8,700 resistance and extended its decline below $8,500.
Moreover, there was a break below the $8,400 and $8,375 support levels. Finally, the price traded to a new weekly and monthly low near $8,343, plus settled well below the 100 hourly simple moving average.
At the moment, the price is correcting higher above the $8,400 level. It is trading close to the 23.6% Fib retracement level of the recent decline from the $8,629 high to $8,343 low.
On the upside, an initial resistance is near the $8,420 level (the recent support). The first major resistance is near the $8,480 level. Additionally, the 50% Fib retracement level of the recent decline from the $8,629 high to $8,343 low is near the $8,480 level.
More importantly, morning’s key bearish trend line is active with resistance near $8,500 on the hourly chart of the BTC/USD pair. Therefore, bitcoin needs to surpass the $8,500 resistance to recover. The next major resistance is near the $8,570 and $8,600 levels.
An intermediate resistance between the first trend line and the second trend line is $8,525 and the 100 hourly simple moving average. A successful close above the 100 hourly SMA and the $8,600 resistance could lead the price towards the $8,660 and $8,700 resistance levels.
Conversely, if the price fails to climbs above $8,500 or $8,600, it might continue to move down. The recent low at $8,343 is a short term support. However, it seems like the bears are eyeing a test of the $8,200 support area, where the bulls are likely to take a stand.
Looking at the chart, bitcoin may perhaps extend its decline below $8,340. Having said that, the bears need to be careful once the price reaches the $8,200 and $8,000 supports.
Technical indicators:
Hourly MACD – The MACD is losing momentum in the bearish zone.
Hourly RSI (Relative Strength Index) – The RSI for BTC/USD is currently sliding below the 40 level.
Major Support Levels – $8,340 followed by $8,200.
Major Resistance Levels – $8,500, $8,570 and $8,600.


