

- Ethereum is currently correcting higher from the $172 support against the US Dollar.
- Bitcoin price is also correcting higher, but it is likely to face resistance near $8,250.
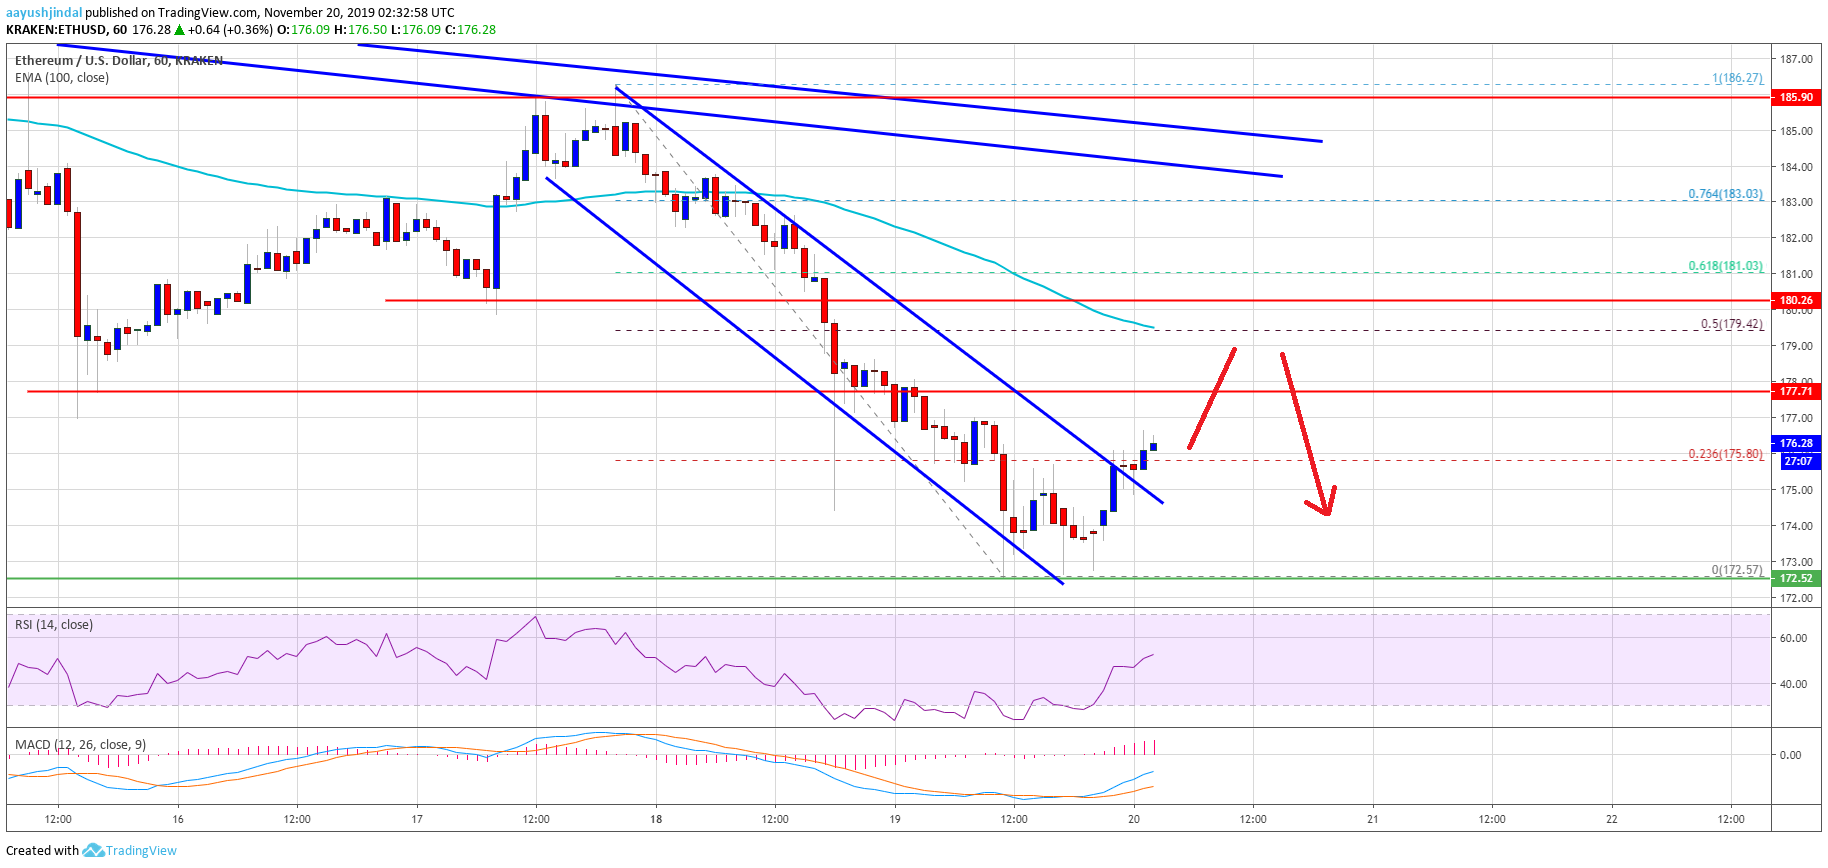
- There was a break above a declining channel with resistance near $175 on the hourly chart of ETH/USD (data feed via Kraken).
- The price is facing a lot of hurdles on the upside near $178 and $180.
Ethereum price is attempting an upside correction versus the US Dollar, similar to bitcoin. However, ETH bears remain in control as long as the price is below $185.
Ethereum Price Analysis
This week, we saw a major downside break in Ethereum below the $180 and $178 supports against the US Dollar. ETH price even settled below the $180 level and the 100 hourly simple moving average.
Finally, there was a break below the $175 support and the price tested the $172 area. A new monthly low was formed near $172 and the price is currently correcting higher. It surpassed the $175 resistance area.
Additionally, there was a break above the 23.6% Fib retracement level of the downward move from the $186 high to $172 low. More importantly, there was a break above a declining channel with resistance near $175 on the hourly chart of ETH/USD.
An immediate resistance on the upside is near the $178 zone (the recent breakdown support area). The main resistance on the upside for Ethereum is near the $180 level and the 100 hourly simple moving average.
Besides, the 50% Fib retracement level of the downward move from the $186 high to $172 low is also near the $180 area. Therefore, an upside break above the $180 resistance may perhaps decrease the current selling pressure.
To move into a positive zone and start a strong rise, the price must break the $185 resistance zone and both bearish trend lines. On the downside, the $175 level could provide support.
The key support is now near the recent low at $172. If there is a downside break below the $172 level, the price is likely to start another major decline towards the $166 and $160 levels in the near term.
Looking at the chart, Ethereum price is attempting an upside correction above the $175 level. Having said that, the bears are still in control as long as the price is trading below $178 and $180. On the downside, they might be looking for a break below the $170 zone.
ETH Technical Indicators
Hourly MACD – The MACD for ETH/USD is currently gaining momentum in the bullish zone.
Hourly RSI – The RSI for ETH/USD is currently moving higher and is above the 50 level.
Major Support Level – $172
Major Resistance Level – $180