
Reason to trust
How Our News is Made
Strict editorial policy that focuses on accuracy, relevance, and impartiality
Ad discliamer
Morbi pretium leo et nisl aliquam mollis. Quisque arcu lorem, ultricies quis pellentesque nec, ullamcorper eu odio.
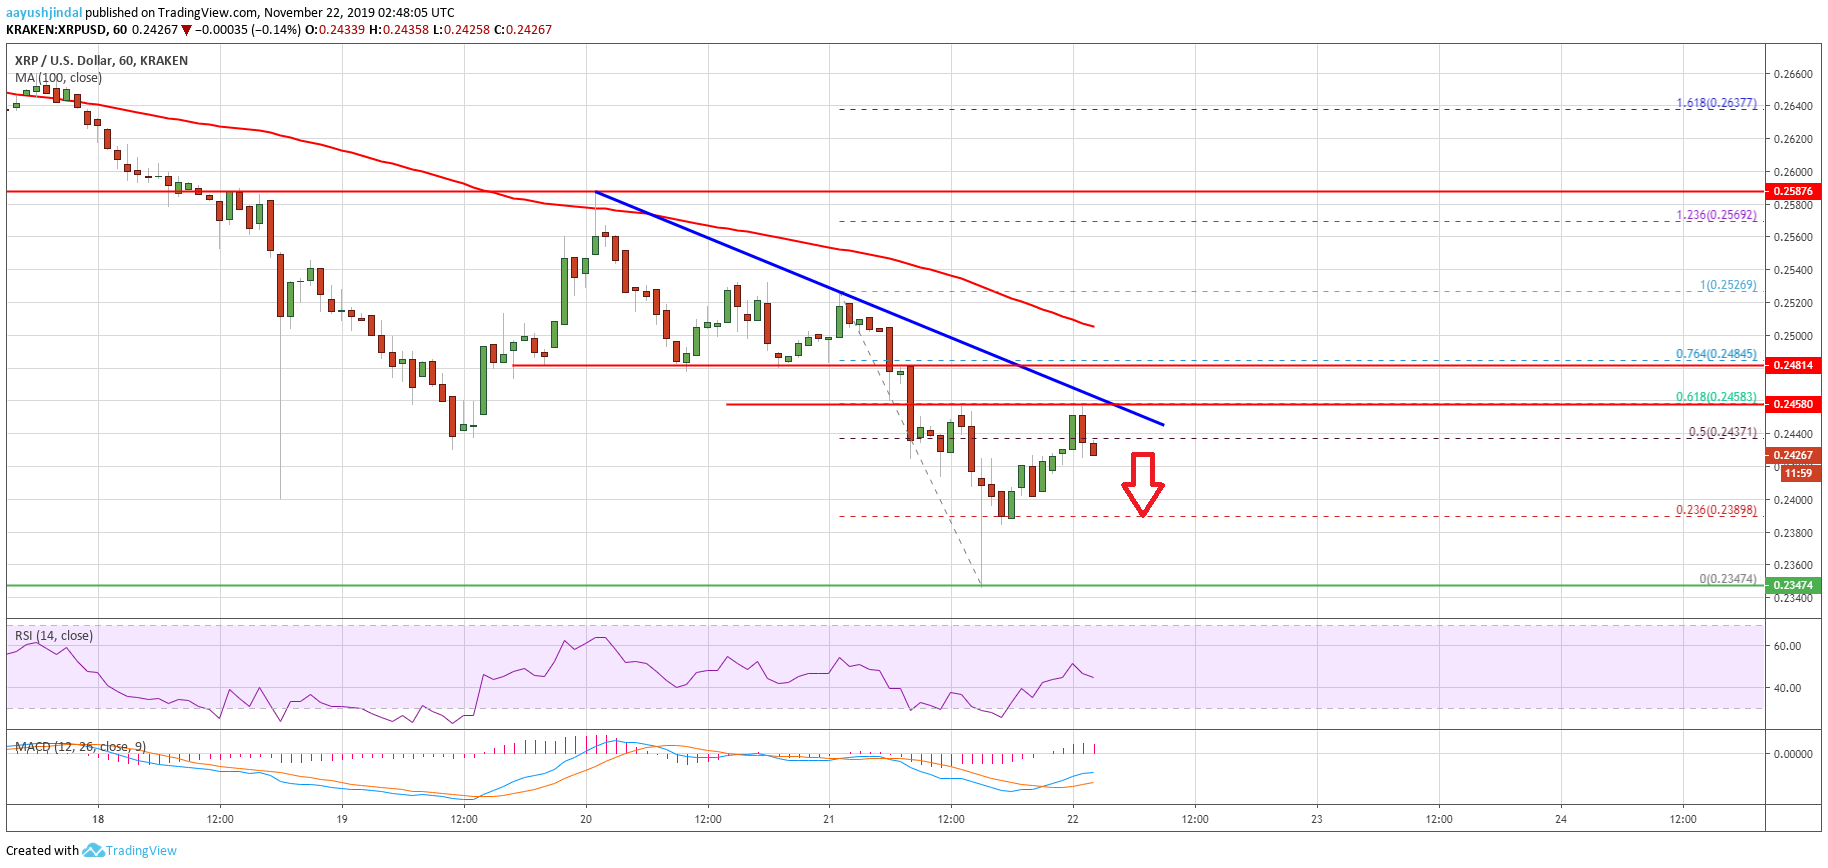
- Ripple price is down 5% and it broke the key $0.2420 support area against the US dollar.
- The price tagged the $0.2350 support area and it is currently correcting higher.
- There is a new bearish trend line forming with resistance near $0.2450 on the hourly chart of the XRP/USD pair (data source from Kraken).
- The price remains at a risk of more losses as long as it is below $0.2580.
Ripple price is now trading below key supports against the US Dollar and bitcoin. XRP price might continue to face sellers near the $0.2480 and $0.2500 resistance levels.
Ripple Price Analysis
In the past three sessions, there was a sharp decline in bitcoin price below the $7,800 support, resulting in a downward push in ripple and Ethereum against the US Dollar. XRP/USD failed to stay above the $0.2450 and $0.2420 support levels, and declined heavily.
Moreover, the price broke the $0.2400 support area and settled well below the 100 hourly simple moving average. Finally, the price tested the $0.2350 support area and a low was formed near $0.2347.
Recently, the price started an upside correction above the $0.2400 resistance area. Besides, there was a break above the 50% Fib retracement level of the recent drop from the $0.2526 high to $0.2347 low.
However, the previous support near the $0.2450 and $0.2460 levels is currently acting as a resistance. Additionally, the 61.8% Fib retracement level of the recent drop from the $0.2526 high to $0.2347 low is also near the $0.2458 level.
More importantly, there is a new bearish trend line forming with resistance near $0.2450 on the hourly chart of the XRP/USD pair. Therefore, ripple price might struggle to clear the $0.2450 and $0.2460 resistance levels.
Should there be an upside break above the $0.2460 resistance, the price could test the $0.2500 area and the 100 hourly SMA. The main resistance for a trend change is near the $0.2580 level.
On the downside, an initial support is near the $0.2400 level. If the price fails to stay above $0.2400, it will most likely continue lower towards the $0.2350 support area.
Looking at the chart, ripple price is clearly positioned in a downtrend below the $0.2450 level. As long as the bears remain in action and the price is below $0.2500, there could be more downsides in the near term.
Technical Indicators
Hourly MACD – The MACD for XRP/USD is struggling to remain in the bullish zone.
Hourly RSI (Relative Strength Index) – The RSI for XRP/USD is currently just above the 40 level, with a minor bullish angle.
Major Support Levels – $0.2400, $0.2360 and $0.2350.
Major Resistance Levels – $0.2450, $0.2460 and $0.2500.


