

- Bitcoin price is consolidating gains above the $7,400 and $7,295 support levels against the US Dollar.
- The price is likely to accelerate higher once it clears the $7,600 and $7,700 resistance levels.
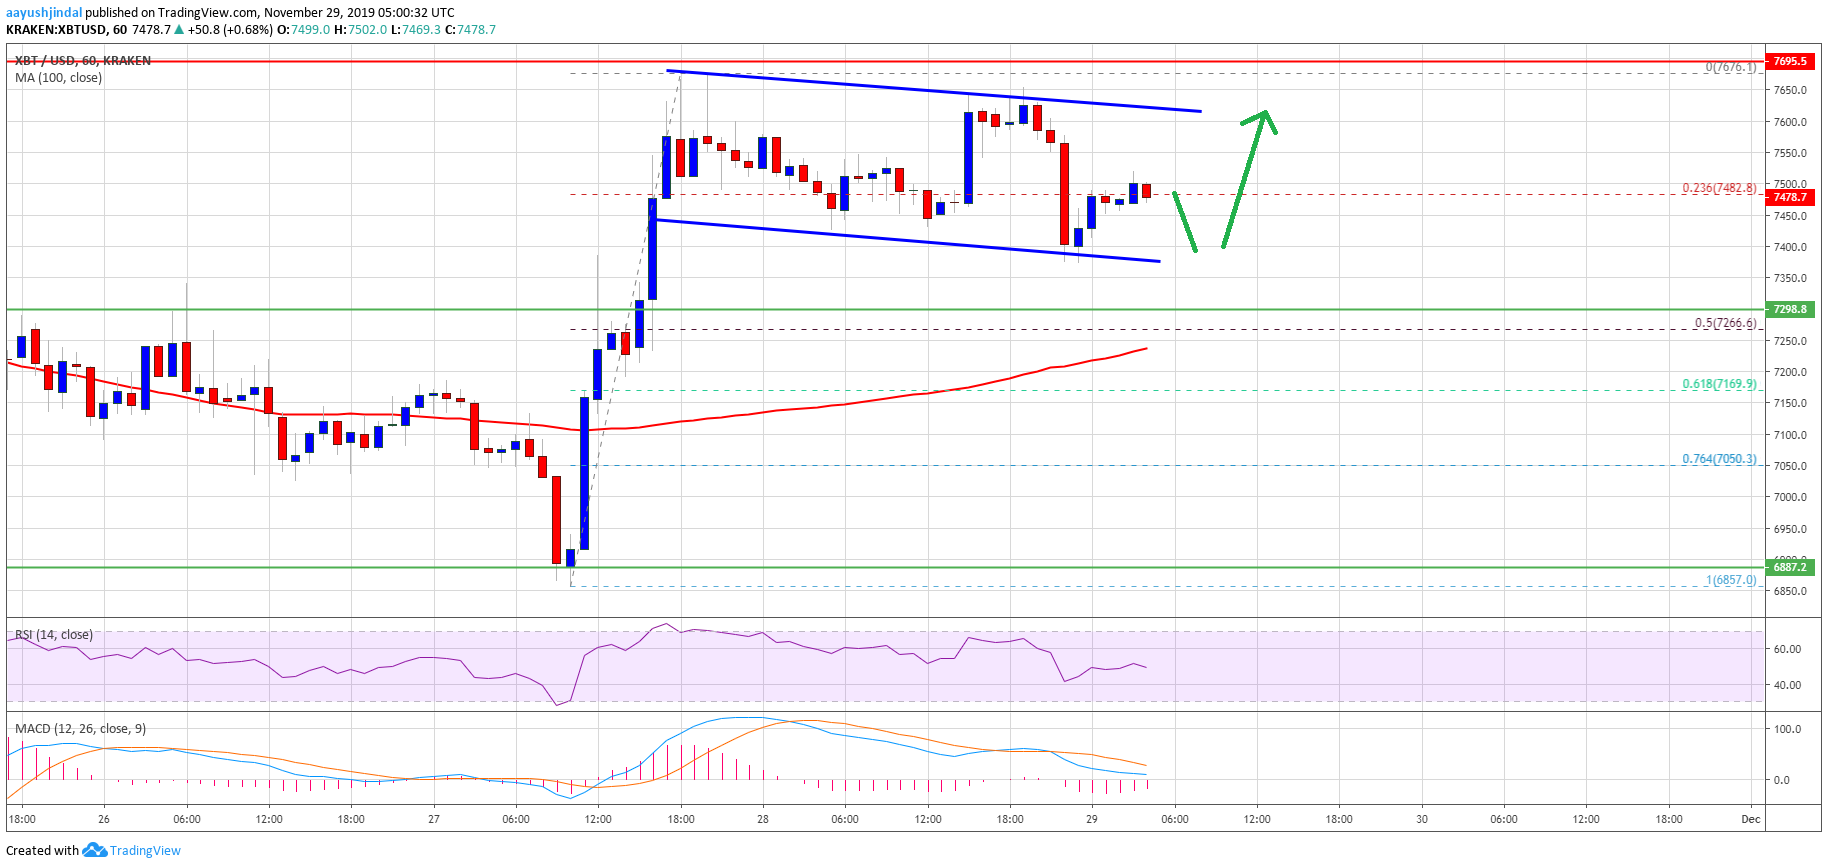
- There is a key declining channel forming with resistance near $7,610 on the hourly chart of the BTC/USD pair (data feed from Kraken).
- The pair remains well supported on dips near the $7,400 and $7,300 levels in the near term.
Bitcoin price is likely forming a bullish pattern above $7,400 against the US Dollar. BTC could soon rally towards $8,000 or $8,200 once it clears the $7,700 resistance region.
Bitcoin Price Analysis
Yesterday, bitcoin climbed above the key $7,300 and $7,400 resistance levels against the US Dollar. Moreover, there was a close above the $7,400 level and the 100 hourly simple moving average.
It opened the doors for more gains above the $7,500 level. Finally, the price tested the next key resistance near $7,700 (as pointed out in the weekly forecast). A high was formed near $7,676 and the price is currently correcting lower.
It traded below the $7,600 and $7,550 levels. Besides, there was a break below the 23.6% Fib retracement level of the upward wave from the $6,855 swing low to $7,676 high.
However, the $7,400 support area seems to be acting as a strong buy zone. If there is a break below the $7,400 support, the price could test the $7,300 and $7,295 support levels.
The next key support is near the $7,260 level and the 100 hourly simple moving average. It coincides with the 50% Fib retracement level of the upward wave from the $6,855 swing low to $7,676 high.
If there is a downside break below the $7,260 level and the 100 hourly SMA, bitcoin could resume its decline. On the other hand, the price is likely to continue higher above the $7,600 resistance.
Additionally, there is a key declining channel forming with resistance near $7,610 on the hourly chart of the BTC/USD pair. A clear break above the $7,600 and $7,700 resistance levels could set the pace for a rise towards $8,000 or even $8,200 in the near term.
Looking at the chart, bitcoin price seems to consolidating gains above the $7,400 and $7,300 support levels. Therefore, the price is likely to climb further above $7,700 as long as there is no close below the main $7,260 support area.
Technical indicators:
Hourly MACD – The MACD is likely to move back into the bullish zone.
Hourly RSI (Relative Strength Index) – The RSI for BTC/USD is currently declining and it is just below the 50 level.
Major Support Levels – $7,400 followed by $7,260.
Major Resistance Levels – $7,540, $7,600 and $7,700.