
Reason to trust
How Our News is Made
Strict editorial policy that focuses on accuracy, relevance, and impartiality
Ad discliamer
Morbi pretium leo et nisl aliquam mollis. Quisque arcu lorem, ultricies quis pellentesque nec, ullamcorper eu odio.
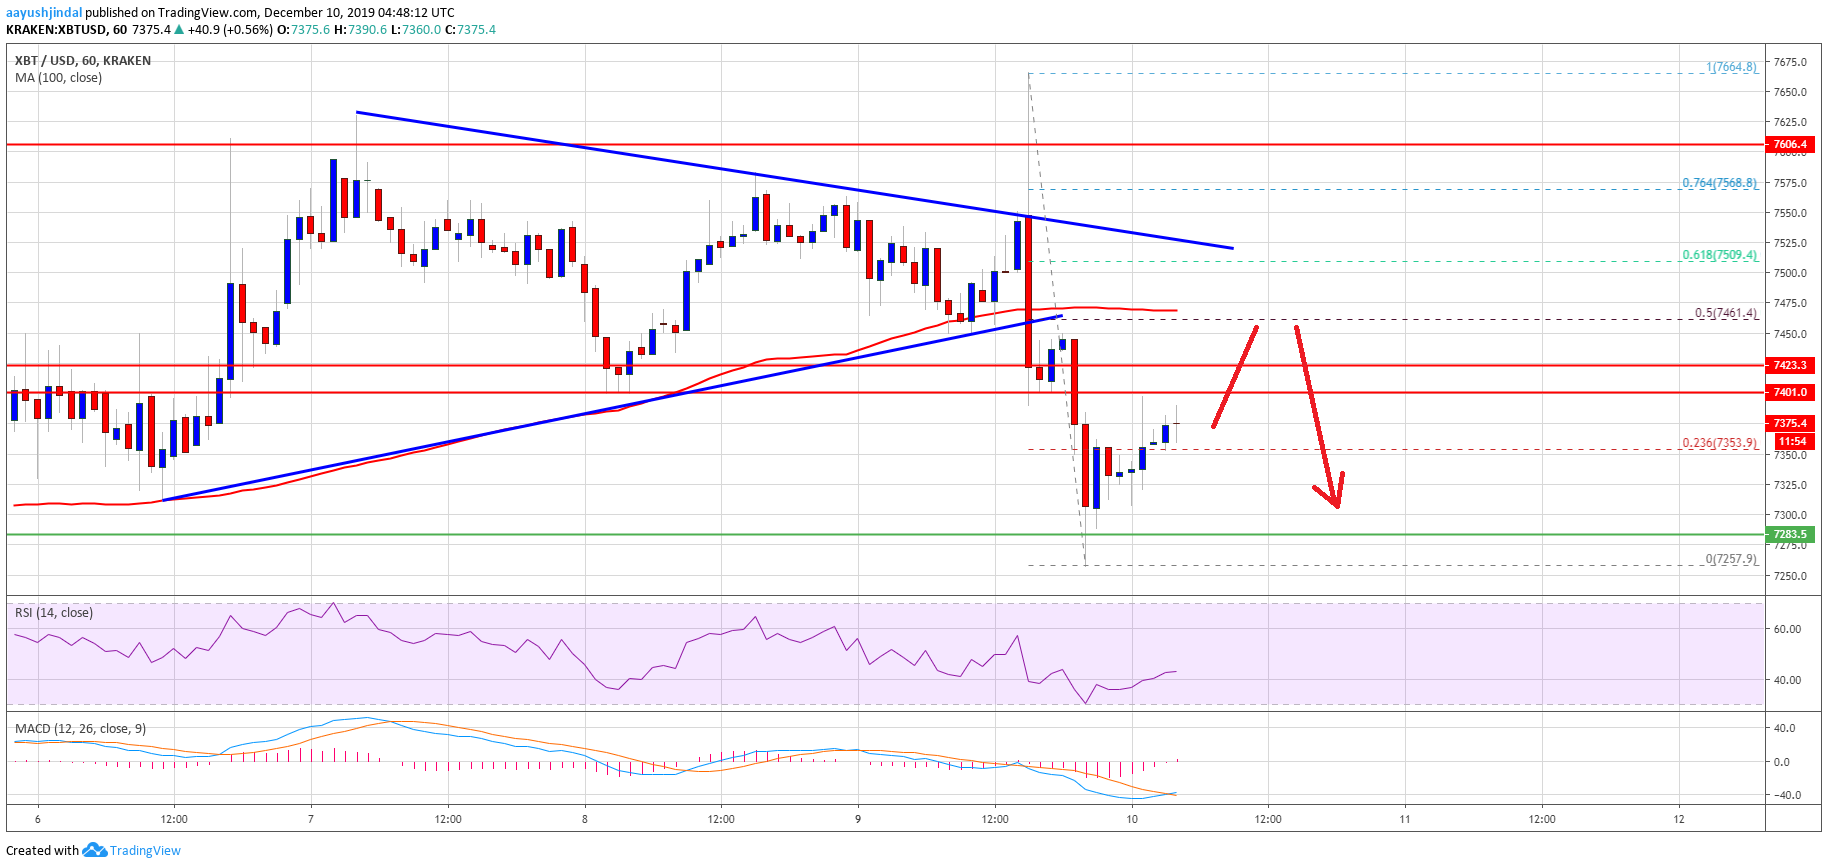
- Bitcoin price traded to a new weekly high at $7,664 and declined recently against the US Dollar.
- The price is now trading below the $7,420 and $7,400 support levels.
- There is a key bearish trend line forming with resistance near $7,525 on the hourly chart of the BTC/USD pair (data feed from Kraken).
- The pair is likely to climb higher, but it could face resistance near $7,420 or $7,500.
Bitcoin price is back in a short-term bearish zone below $7,400 against the US Dollar. BTC must stay above $7,280 to climb high again in the near term.
Bitcoin Price Analysis
Yesterday, we discussed the chances of an upside extension in bitcoin price above $7,500 against the US Dollar. BTC price did climb higher above the $7,500 resistance and the 100 hourly simple moving average.
Moreover, there was a spike above the $7,600 level, but the price failed to test the $7,700 resistance area. A new weekly high is formed near $7,664 and the price declined recently.
It traded below the $7,500 pivot level and the 100 hourly simple moving average. Besides, there was a break below the $7,420 and $7,400 support levels. More importantly, bitcoin price traded below a connecting bullish trend line with support near $7,460 on the hourly chart of the BTC/USD pair.
Finally, the price spiked below $7,300 and traded as low as $7,257. It is currently correcting higher above the 23.6% Fib retracement level of the recent decline from the $7,664 high to $7,257 low.
On the upside, there are a few important resistances near $7,400 and $7,420 (the previous support levels). The next key resistance is near the $7,460 level and the 100 hourly SMA.
Additionally, the 50% Fib retracement level of the recent decline from the $7,664 high to $7,257 low is near the $7,460 level to act as a resistance. There is also a key bearish trend line forming with resistance near $7,525 on the same chart.
Therefore, an upward move towards the $7,460 and $7,500 levels may perhaps face a strong resistance. If there is an upside break above $7,500, the price could revisit $7,460 or $7,700.
Looking at the chart, bitcoin price is back in a short-term bearish zone below $7,420. If it recovers and settles above $7,420, it may perhaps attempt to surpass $7,500. On the downside, the $7,280 and $7,250 levels hold the key in the near term.
Technical indicators:
Hourly MACD – The MACD is slowly moving back into the bullish zone.
Hourly RSI (Relative Strength Index) – The RSI for BTC/USD is currently recovering and above the 40 level.
Major Support Levels – $7,280 followed by $7,250.
Major Resistance Levels – $7,420, $7,460 and $7,500.


