
Reason to trust
How Our News is Made
Strict editorial policy that focuses on accuracy, relevance, and impartiality
Ad discliamer
Morbi pretium leo et nisl aliquam mollis. Quisque arcu lorem, ultricies quis pellentesque nec, ullamcorper eu odio.
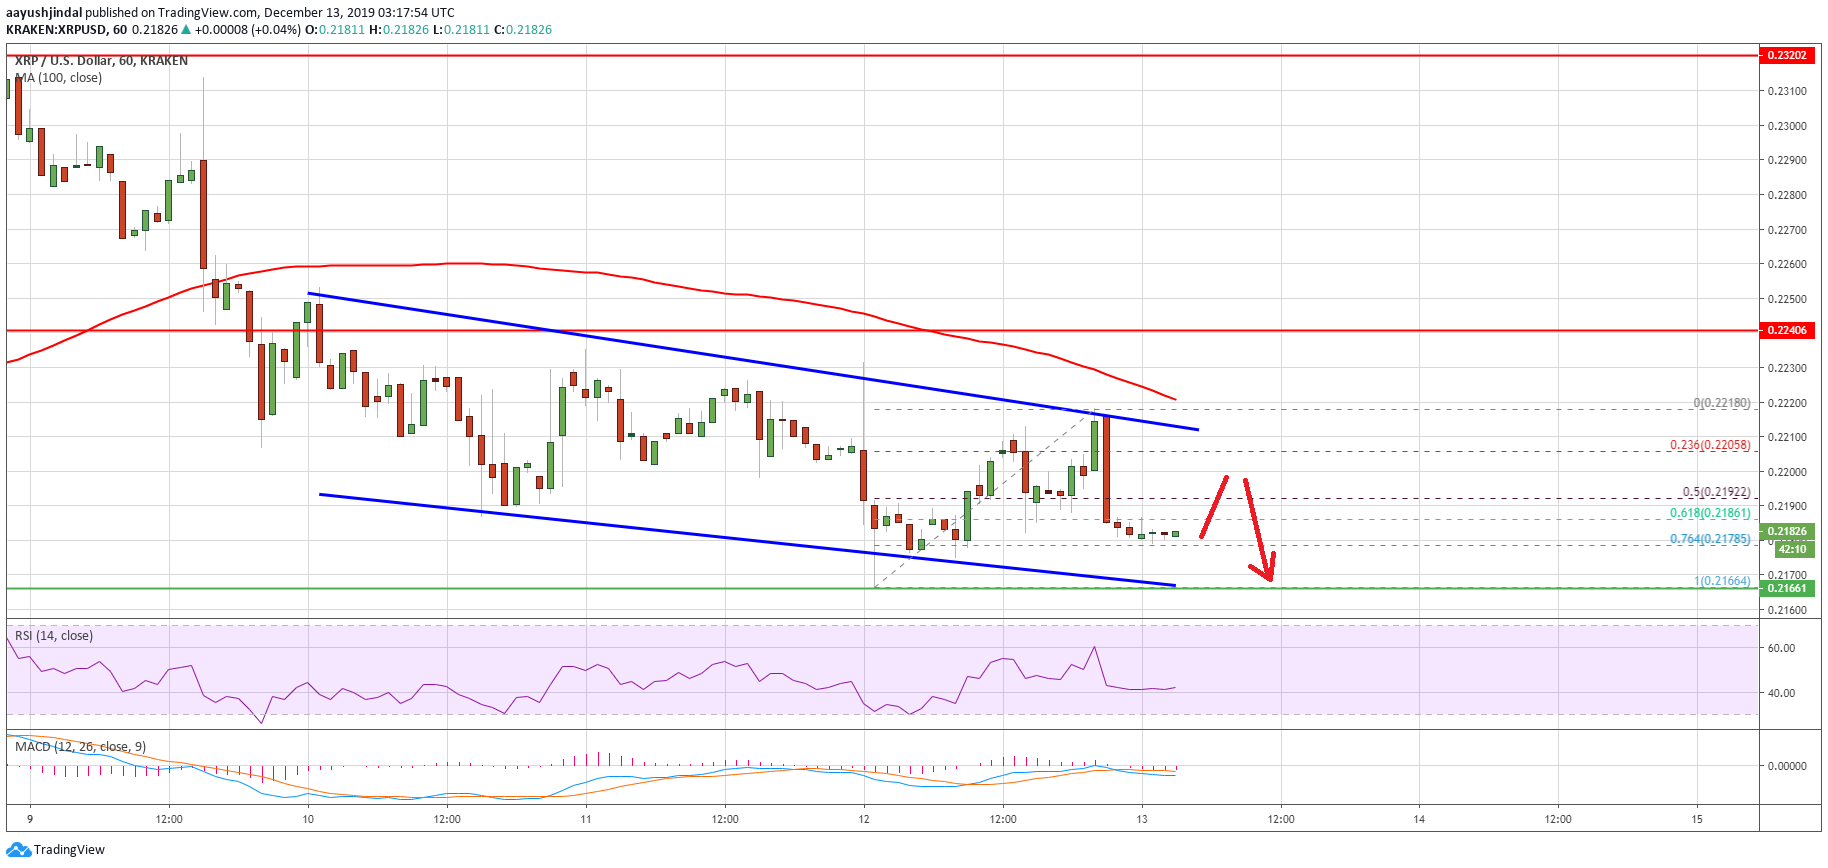
- Ripple price is struggling to recover above the $0.2200 resistance area against the US dollar.
- The price remains at a risk of more downsides below the $0.2180 support area.
- There is a declining channel forming with resistance near $0.2210 on the hourly chart of the XRP/USD pair (data source from Kraken).
- Ethereum recovered a few points, but it is struggling to clear the $145-$146 resistance area.
Ripple price is facing an uphill task against the US Dollar and bitcoin. XRP price could accelerate its decline once it breaks the $0.2180 and $0.2160 support levels.
Ripple Price Analysis
In the past few days, there was a steady decline in ripple price below the $0.2250 level against the US Dollar. Moreover, XRP price settled below the $0.2200 support area and the 100 hourly simple moving average.
The decline was such that the price tested the $0.2160 support. A low was formed near $0.2166 and recently the price corrected higher. It recovered above the $0.2180 level, but it struggled to gain momentum above the $0.2200 and $0.2210 levels.
A high is formed near $0.2218 and the price is declining below $0.2200. Besides, ripple price traded below 50% Fib retracement level of the recent wave from the $0.2166 low to $0.2218 high.
The current price action is bearish below the $0.2200 level. An initial support is near the $0.2180 level. Additionally, the 76.4% Fib retracement level of the recent wave from the $0.2166 low to $0.2218 high is also near the $0.2180 level.
Therefore, a downside break below $0.2180 could push the price below the $0.2160 support area. The next major support is near $0.2120. Any further losses may perhaps lead the price towards the $0.2100 level.
On the upside, the $0.2200 and $0.2220 levels are important hurdles. Moreover, there is a declining channel forming with resistance near $0.2210 on the hourly chart of the XRP/USD pair.
A successful close above the channel resistance and $0.2220 is needed for the price to start a decent recovery in the near term. The next key resistances are near $0.2250 and $0.2260.
Looking at the chart, ripple price is under a lot of pressure below the $0.2200 resistance area. The bears remain in action and it seems like they are eyeing a downside break below the $0.2180 and $0.2160 support levels.
Technical Indicators
Hourly MACD – The MACD for XRP/USD is currently moving in the bearish zone.
Hourly RSI (Relative Strength Index) – The RSI for XRP/USD is currently just above the 40 level.
Major Support Levels – $0.2180, $0.2160 and $0.2120.
Major Resistance Levels – $0.2200, $0.2220 and $0.2250.