
Reason to trust
How Our News is Made
Strict editorial policy that focuses on accuracy, relevance, and impartiality
Ad discliamer
Morbi pretium leo et nisl aliquam mollis. Quisque arcu lorem, ultricies quis pellentesque nec, ullamcorper eu odio.
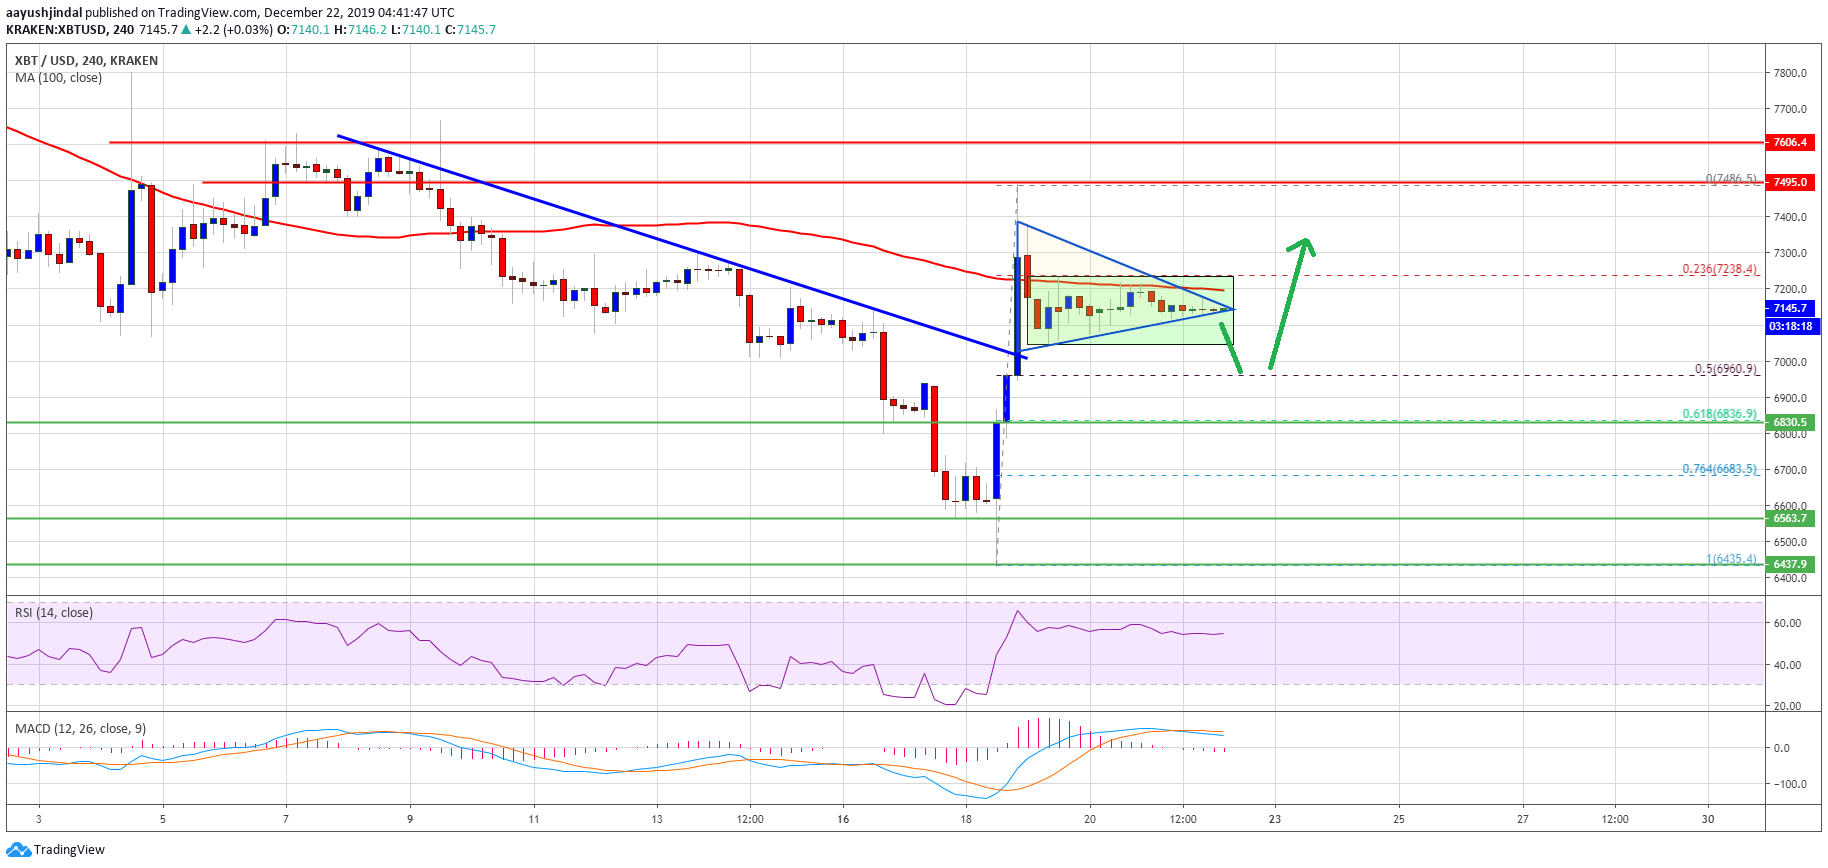
- There was a nice upward move in bitcoin price from the $6,435 low against the US Dollar.
- The price is now trading nicely above the $7,000 and $6,960 support levels.
- There is likely a bullish continuation pattern forming resistance near $7,180 on the 4-hours chart of the BTC/USD pair (data feed from Kraken).
- The price could decline a few points before it starts a fresh increase above the $7,300 resistance.
Bitcoin price is now trading in a positive zone above $7,000 against the US Dollar. BTC remains well supported on dips as long as there is no close below $6,830.
Bitcoin Price Weekly Analysis (BTC)
This past week, bitcoin started a strong recovery wave from the $6,400-$6,500 support area against the US Dollar. BTC price broke a few hurdles near the $7,000 level and the 100 simple moving average (4-hours).
Moreover, the price rallied above the $7,200 and $7,300 resistance levels. Finally, it traded close to the $7,500 resistance and a new weekly high was formed near the $7,486 level.
Later, bitcoin started a downside correction below the $7,300 level and the 100 simple moving average (4-hours). Besides, there was a break below the 23.6% Fib retracement level of the upward move from the $6,435 low to $7,486 high.
At the moment, the price seems to be trading in a range above the $7,000 support and below the $7,240 resistance. Additionally, there is likely a bullish continuation pattern forming resistance near $7,180 on the 4-hours chart of the BTC/USD pair.
Therefore, if there is an upside break above the $7,180 and $7,240 resistance levels, the price could start another bullish wave. An immediate resistance is near the $7,300 level, above which the price could rally towards $7,500 and $7,600.
Conversely, there could be a downside break below the $7,100 and $7,000 support levels. In the mentioned case, the price might test the $6,960 support area. It represents the 50% Fib retracement level of the upward move from the $6,435 low to $7,486 high.
The main support is near the $6,830 level, below which the price is likely to restart its downtrend and move back into a bearish zone. The next major supports are near $6,500 and $6,400.
Looking at the chart, bitcoin price is clearly trading in a positive zone above the $7,000 and $6,960 support levels. In the short term, there could be either range moves or a minor dip towards $6,960 before the price starts another increase.
Technical indicators
4 hours MACD – The MACD for BTC/USD is slowly losing bullish momentum.
4 hours RSI (Relative Strength Index) – The RSI for BTC/USD is still well above the 50 level.
Major Support Level – $6,960
Major Resistance Level – $7,240


