
Reason to trust
How Our News is Made
Strict editorial policy that focuses on accuracy, relevance, and impartiality
Ad discliamer
Morbi pretium leo et nisl aliquam mollis. Quisque arcu lorem, ultricies quis pellentesque nec, ullamcorper eu odio.
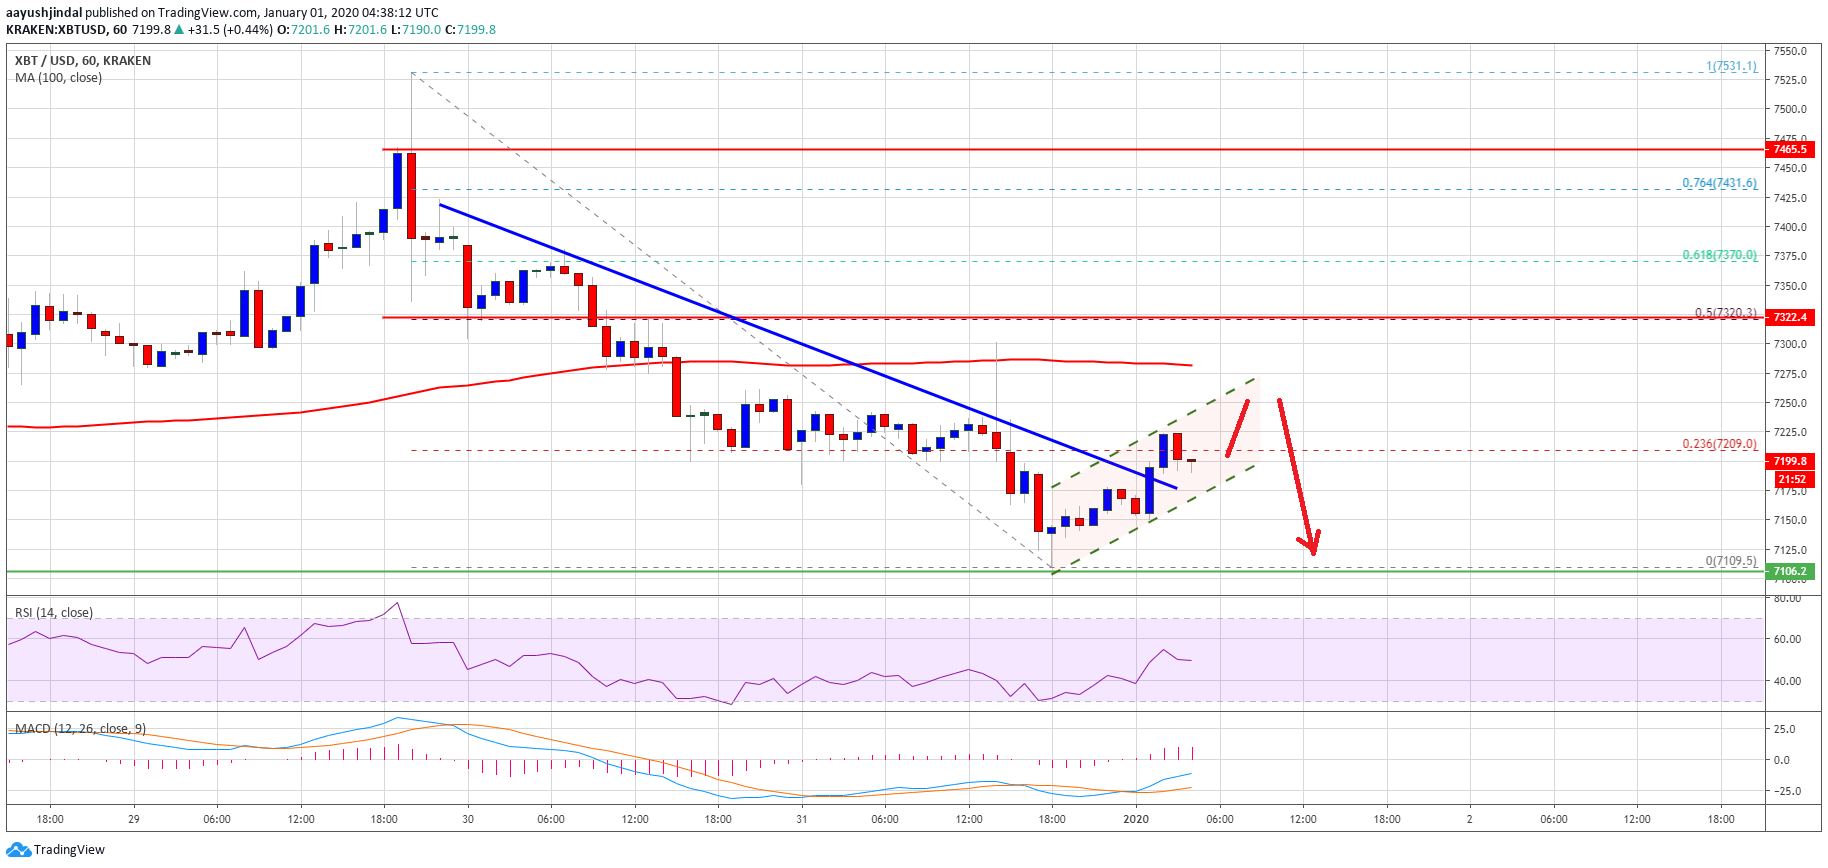
- Bitcoin price is slowly declining and recently tested $7,100 against the US Dollar.
- The price is currently recovering, but likely to face hurdles near $7,280 and $7,320.
- There was a break above a major bearish trend line with resistance near $7,185 on the hourly chart of the BTC/USD pair (data feed from Kraken).
- The pair might slide further towards $7,000 unless there is a break above the $7,320 resistance.
Bitcoin price is struggling to hold key supports against the US Dollar. BTC remains at a risk of more downsides towards $7,000 and $6,880 before a decent upward move.
Bitcoin Price Analysis
In the past few sessions, there was a steady decline in bitcoin price below the $7,320 support against the US Dollar. Moreover, BTC settled below $7,320 and the 100 hourly simple moving average.
The recent decline was such that the price even traded below the $7,200 and $7,150 support levels. A new weekly low is formed near $7,109 and the price is currently correcting higher above $7,150.
Besides, there was a break above a major bearish trend line with resistance near $7,185 on the hourly chart of the BTC/USD pair. Bitcoin price is now trading near the 23.6% Fib retracement level of the downward move from the $7,531 high to $7,109 low.
It seems like there is a short term ascending channel forming with resistance near $7,250. The first key resistance is near the $7,275 level and the 100 hourly simple moving average.
The next major resistance is near the $7,320 level. Additionally, the 50% Fib retracement level of the downward move from the $7,531 high to $7,109 low is near the $7,320 resistance area.
A successful close above the $7,320 resistance might set the pace for a strong upward move. In the mentioned case, the price might continue to rise towards the $7,400 and $7,500 resistance levels.
On the other hand, the price might fail to continue higher above $7,275 and $7,320. In this bearish case, the price might extend its decline below $7,150. An immediate support is near the $7,100 area, below which there is a risk of a breakdown below $7,000.
Looking at the chart, bitcoin price is showing bearish signs below the $7,320 level and the 100 hourly SMA. Therefore, there are chances of more losses this week unless the bulls push the price above $7,320.
Technical indicators:
Hourly MACD – The MACD is currently moving in the bullish zone.
Hourly RSI (Relative Strength Index) – The RSI for BTC/USD is now just below the 50 level.
Major Support Levels – $7,100 followed by $7,000.
Major Resistance Levels – $7,275, $7,320 and $7,500.