
Reason to trust
How Our News is Made
Strict editorial policy that focuses on accuracy, relevance, and impartiality
Ad discliamer
Morbi pretium leo et nisl aliquam mollis. Quisque arcu lorem, ultricies quis pellentesque nec, ullamcorper eu odio.
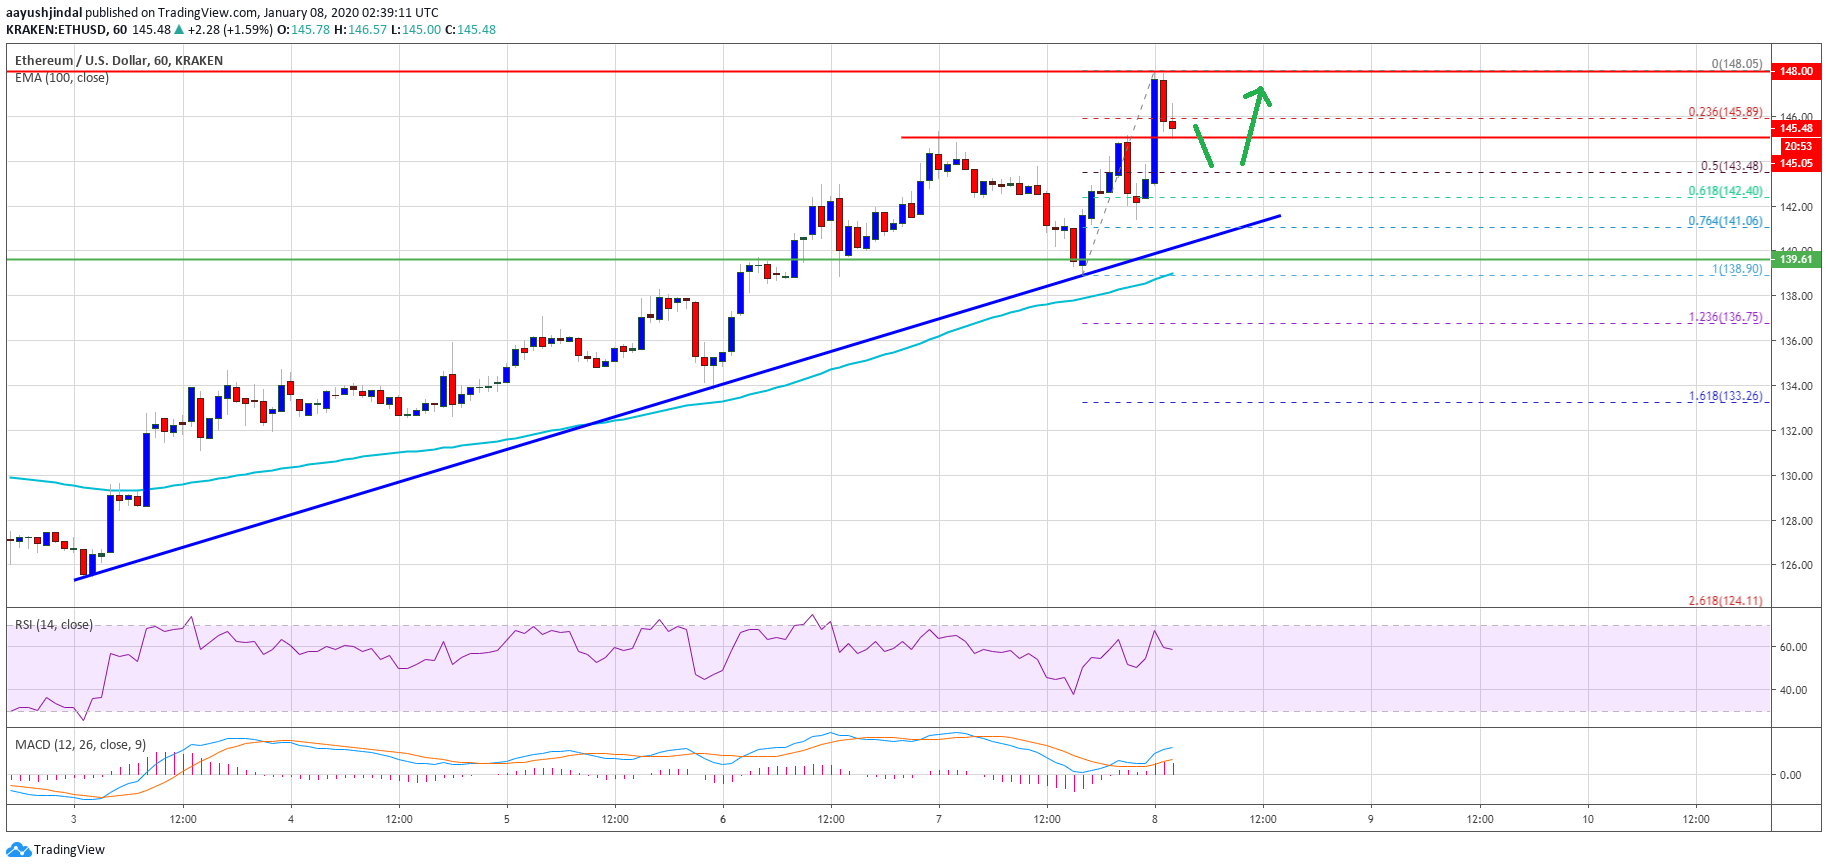
Ethereum rising steadily above the $142 and $145 resistance levels versus the US Dollar. Besides, bitcoin surged close to 5% above $8,400, opening the doors for an upside break in ETH above $150.
- Ether price traded to a new 2020 high at $148 and it is currently consolidating against the US Dollar.
- The price seems to be struggling to gain momentum above $148 and $150.
- Yesterday’s highlighted important bullish trend line is intact with support near $142 on the hourly chart of ETH/USD (data feed via Kraken).
- Bitcoin rallied $400, tested the $8,450 area and it is currently correcting lower.
Ethereum Price Rising Steadily
In the past few sessions, there were steady gains in Ethereum above the $140 resistance against the US Dollar. Moreover, ETH price surpassed the $142 and $145 resistance levels.
Finally, the price traded to a new 2020 high at $148 and it is currently consolidating gains. It is trading near the 23.6% Fib retracement level of the upward move from the $139 low to $148 high.
It seems like the price is finding support near the $145 level. The next key support is between $143 and $144. Besides, the 50% Fib retracement level of the upward move from the $139 low to $148 high is also near the $143.50 level.
More importantly, yesterday’s highlighted important bullish trend line is intact with support near $142 on the hourly chart of ETH/USD. Therefore, dips in Ethereum could find support near $143 and $142.
As long as the price is above the $142 support, the bulls are likely to push the price above the $148 and $150 resistance levels. The next major target for them could be the key $158 resistance area in the near term.
Important Buy Zones for ETH
If there is a downside break below the $142 support, the price could start a downside extension towards the $138 support area and the 100 hourly simple moving average.
The main support is near the $135 level, where the bulls are likely to take a stand. Any further losses may perhaps start a fresh decline towards the $128 support.
Looking at the chart, Ethereum price is showing positive signs above the $142 support and the 100 hourly SMA. In the short term, there could be a minor dip, but the price is likely to bounce back and climb above $148 and $150.
Technical Indicators
Hourly MACD – The MACD for ETH/USD is currently gaining in the bullish zone.
Hourly RSI – The RSI for ETH/USD is correcting lower towards the 50 level.
Major Support Level – $142
Major Resistance Level – $150


